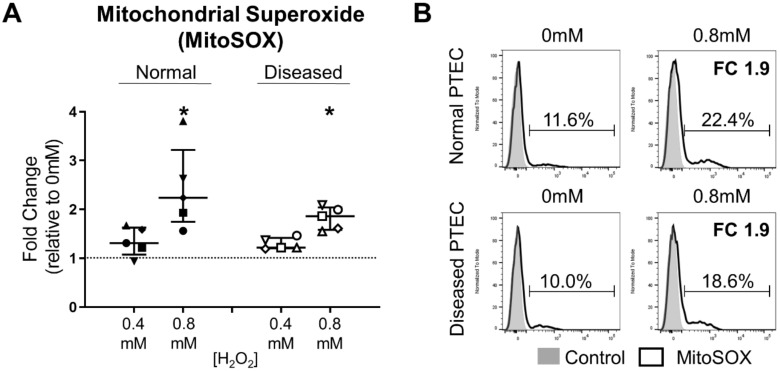
Figure 3.
Significantly elevated mitochondrial superoxide levels in normal and diseased PTEC during high-level oxidative stress. (A) Fold changes (relative to 0 mM H2O2 cells) in mitochondrial superoxide levels (% MitoSOX+ cells) in normal and diseased PTEC cultured under low-level (0.4 mM H2O2) and high-level (0.8 mM H2O2) oxidative stress conditions. The dashed line represents a fold change of 1. Symbols represent individual donor PTEC; n = 5 donor PTEC per group. Horizontal bars represent medians, with interquartile range also presented. * p < 0.05 vs 0 mM H2O2, Friedman test with Dunn’s post-test. (B) Representative donor histograms of MitoSOX staining (black unfilled) in normal and diseased PTEC cultured in the absence (0mM) and presence (0.8 mM) of H2O2 compared with unstained control (grey filled). Mitochondrial superoxide levels (% MitoSOX+ cells) are presented for each histogram, with fold change (FC) values relative to 0 mM H2O2 cells also shown.

