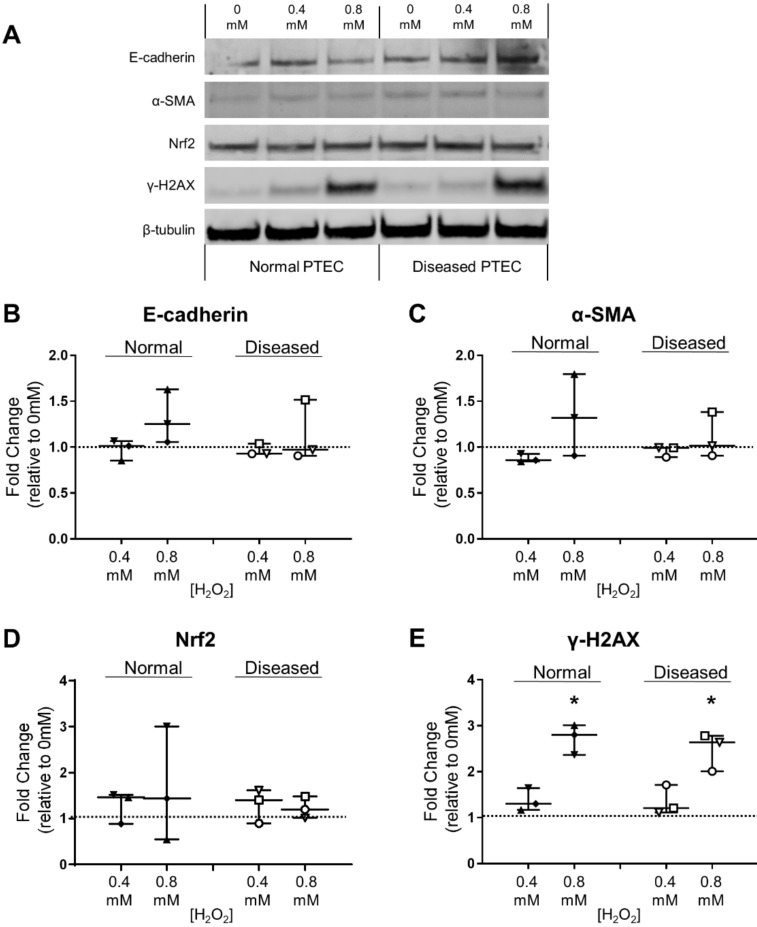
Figure 4.
Significantly elevated DNA damage response in normal and diseased PTEC during high-level oxidative stress. (A) Western blot for E-cadherin, α-SMA, Nrf2 and γ-H2AX in whole cell extracts (20 µg total protein) from normal and diseased PTEC cultured in the absence (0 mM H2O2) or presence of low-level (0.4 mM) and high-level (0.8 mM) H2O2. Representative data from one of three normal PTEC and one of three diseased PTEC are presented. Full unedited gels available in the Supplementary File. (B–E) Fold changes (relative to 0 mM H2O2 cells) in E-cadherin (B), α-SMA (C), Nrf2 (D), and γ-H2AX (E) protein levels in normal and diseased PTEC cultured under low-level (0.4 mM H2O2) and high-level (0.8 mM H2O2) oxidative stress conditions. The dashed line represents a fold change of 1. Symbols represent individual donor PTEC; n = 3 donor PTEC per group. Horizontal bars represent medians, with interquartile range also presented. * p < 0.05 vs 0 mM H2O2, Friedman test with Dunn’s post-test.

