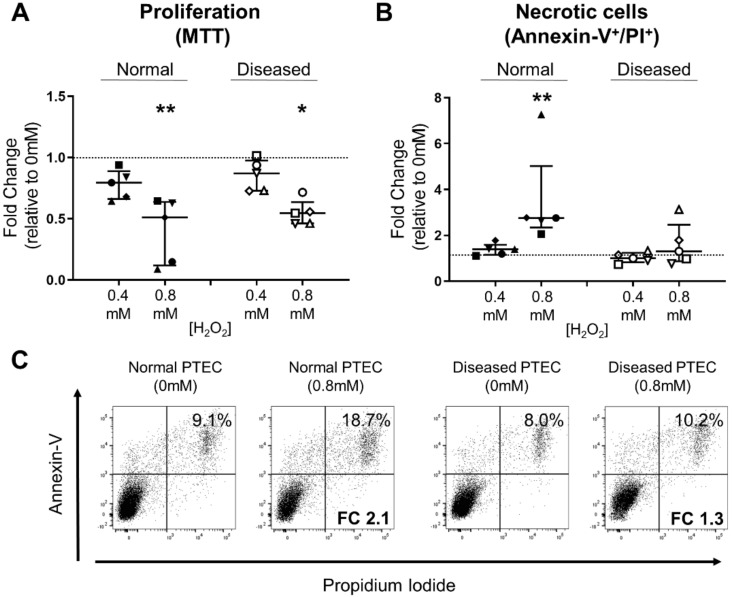
Figure 6.
Diseased PTEC maintain cell viability under high-level oxidative stress conditions. (A,B) Fold changes (relative to 0 mM H2O2 cells) in cell proliferation (MTT assay) (A) and PTEC necrosis (% Annexin-V+ PI+ cells) (B) in normal and diseased PTEC cultured under low-level (0.4 mM H2O2) and high-level (0.8 mM H2O2) oxidative stress conditions. The dashed line represents a fold change of 1. Symbols represent individual donor PTEC; n = 5 donor PTEC per group. Horizontal bars represent medians, with interquartile range also presented. * p < 0.05, ** p < 0.01 vs 0 mM H2O2, Friedman test with Dunn’s post-test. (C) Representative donor Annexin-V/PI dot plots of normal and diseased PTEC cultured in the absence (0 mM) and presence (0.8 mM) of H2O2. The percentage of Annexin-V+ PI+ necrotic cells for each dot plot are presented, with fold change (FC) values relative to 0 mM H2O2 cells also shown.

