Figure 7.
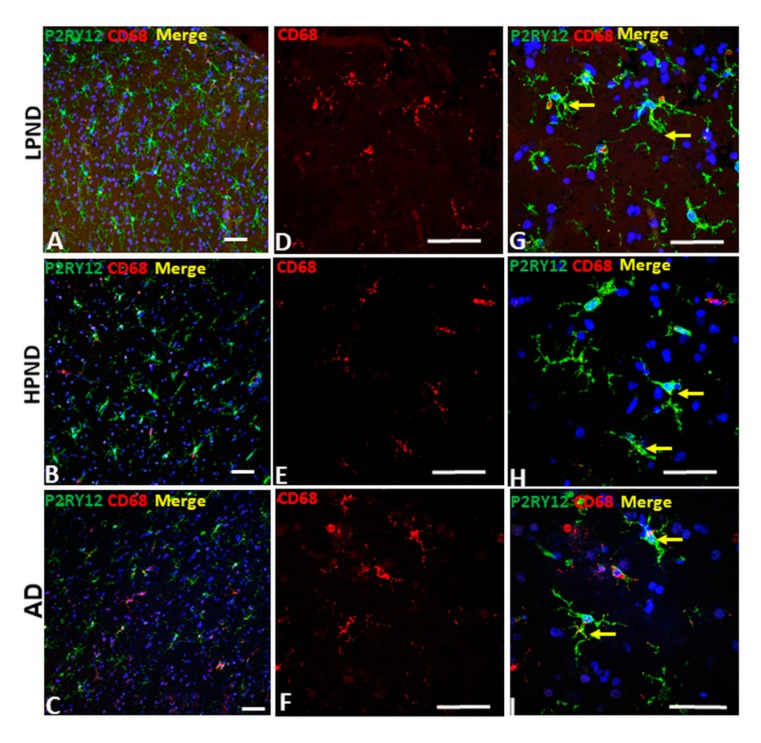
Confocal microscopy of P2RY12 and CD68-positive microglia in pathologically staged cases. A–C). Low magnification merged images of P2RY12 (green), CD68 (red) and DAPI (blue) in MTG of LPND (A), HPND (B) and AD cases (C) to show the distribution of P2RY12 and CD68 immunoreactivity through cortical layer. Scale bars represent 50 μm. (D–F). Higher magnification merged images of CD68 (red) in MTG of LPND (D), HPND (E) and AD cases (F) to show the distribution of CD68 immunoreactivity. Similar amounts of CD68 immunoreactivity was present in each disease group. Scale bars represent 50 μm. (G–I). Merged images of P2RY12 (green) with the CD68 (red) images shown in (D,E)) with DAPI (blue). Scale bars represent 50 μm.

