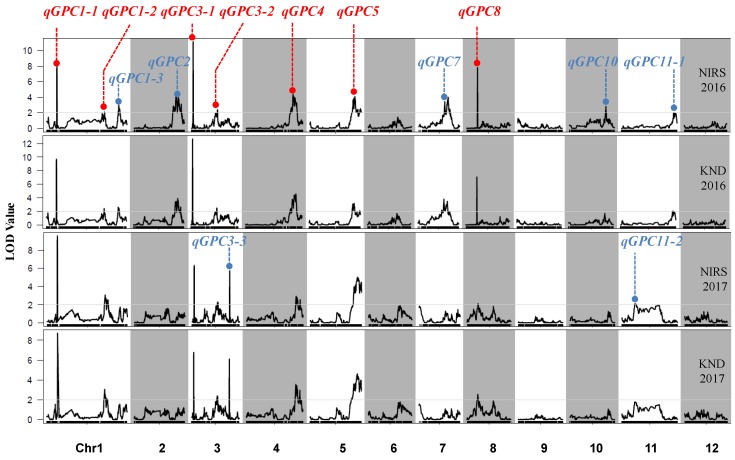
Figure 3.
The identified QTLs for GPC measured by the NIRS and KND methods through analyzing the SNP genotypes and corresponding phenotypes of the 280 RILs. Red font indicates that QTLs were detected in both 2016 and 2017, and blue font indicates that QTLs were identified in either year 2016 or 2017.

