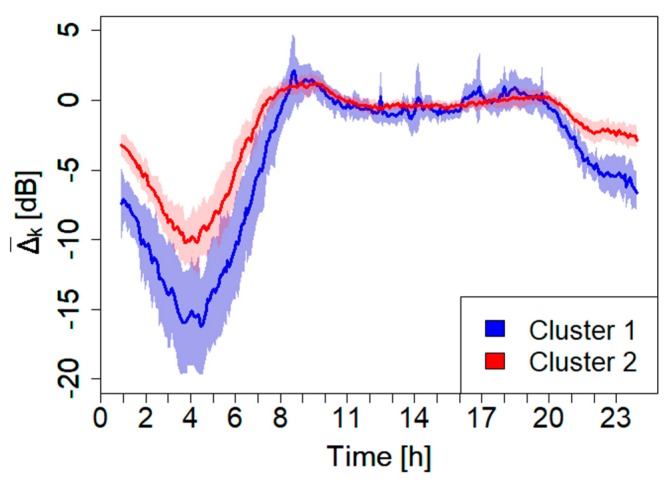
Figure 7.
Mean normalized cluster profiles, and the corresponding error band, k indicates the cluster index. Time resolution min. The colored band represents the 1σ confidence level. The normalized level used here is the same as the one determined in Figure 6.

