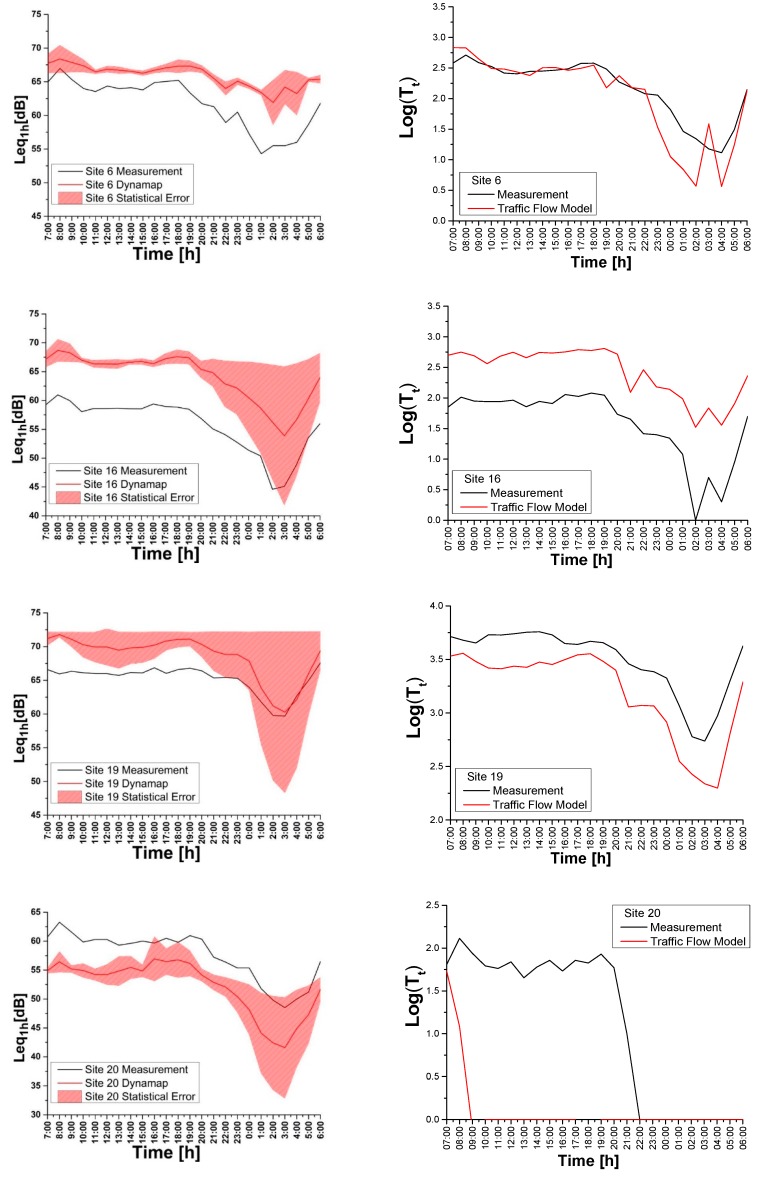
Figure 14.
(Left side) Comparison between traffic noise measurements and DYNAMAP predictions at: Site 6 (group g = 3), Site 16 (group g = 4), Site 19 (group g = 6), Site 20 (group g = 1). The colored band represents the 1σ confidence level. (Right side) Comparison between traffic flow measurements and AMAT traffic model at the same sites.

