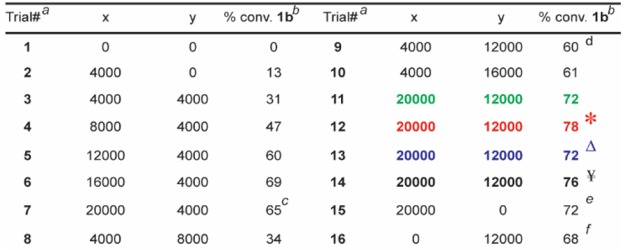
Table 1. Screen for the Optimal Equivalences of MgCl2 and NH4Clg.
All reactions were run with 1 nmol of 1a.
The percent conversions (% conv.) were determined by LC/MS after the quenching procedure, as described in the Supporting Information.
The MS trace was of higher quality relative to that of Trial 6 despite a lower conversion.
The MS trace was of higher quality relative to Trial 10.
The MS signals for those were of lower quality relative to Trial 10.
*Catalyst B instead of A. ΔCatalyst B instead of A, reaction time 5 min. ¥Catalyst B instead of A, reaction time 60 min.


