Figure 2.
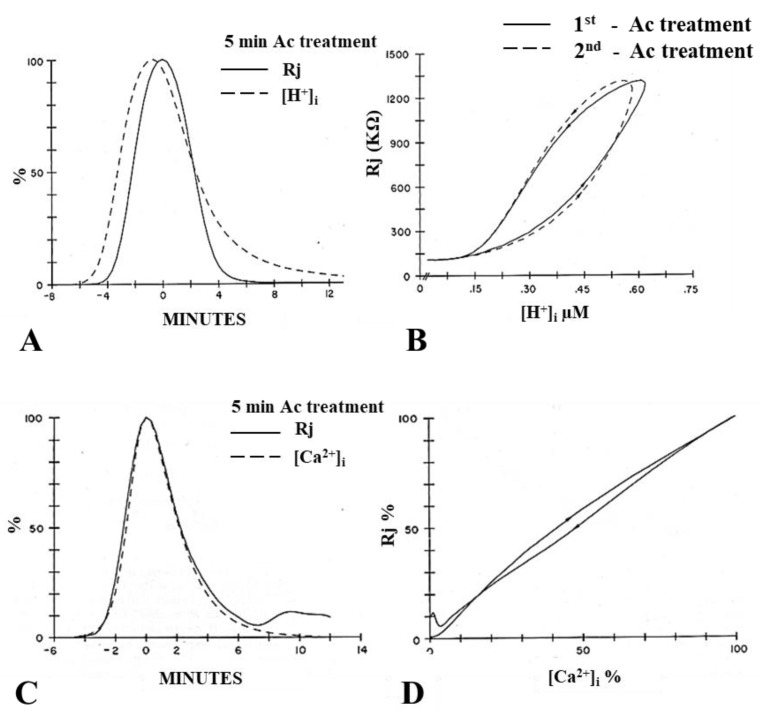
Percent change in junctional resistance (Rj) and [H+]i in septal junctions of crayfish axons during cytosolic acidification with acetate solutions (Ac). (A). Plots of Rj–[H+]i markedly differ in shape, and [H+]i maxima precede Rj maxima by 40–90 s. (B). This results in marked curve hysteresis in the Rj–[H+]i relationship, demonstrated in two different acetate superfusions (B: 1st and 2nd Ac treatments). In contrast, the Rj-[Ca2+]i time courses (C) match extremely well in shape, peak time and magnitude. This results in negligible curve hysteresis in the Rj-[Ca2+]i relationship (D). From Reference [28].

