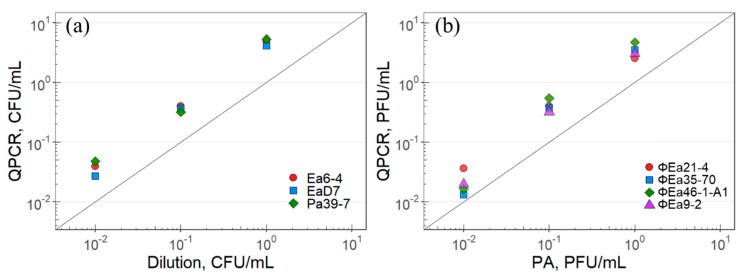
Figure 3.
Correlation between the quantification using plating techniques and qPCR-based assays. (a) Bacterial quantification using dilution plating compared to qPCR for E. amylovora (Ea) and P. agglomerans (Pa). (b) Phage quantification using plaque assays compared to DNase-based qPCR for the four phages tested. The symbols represent the mean of matched-pair data produced in triplicate, which was normalized to the initial CFU/mL or PFU/mL. The diagonal lines represent prefect agreement between the two techniques.

