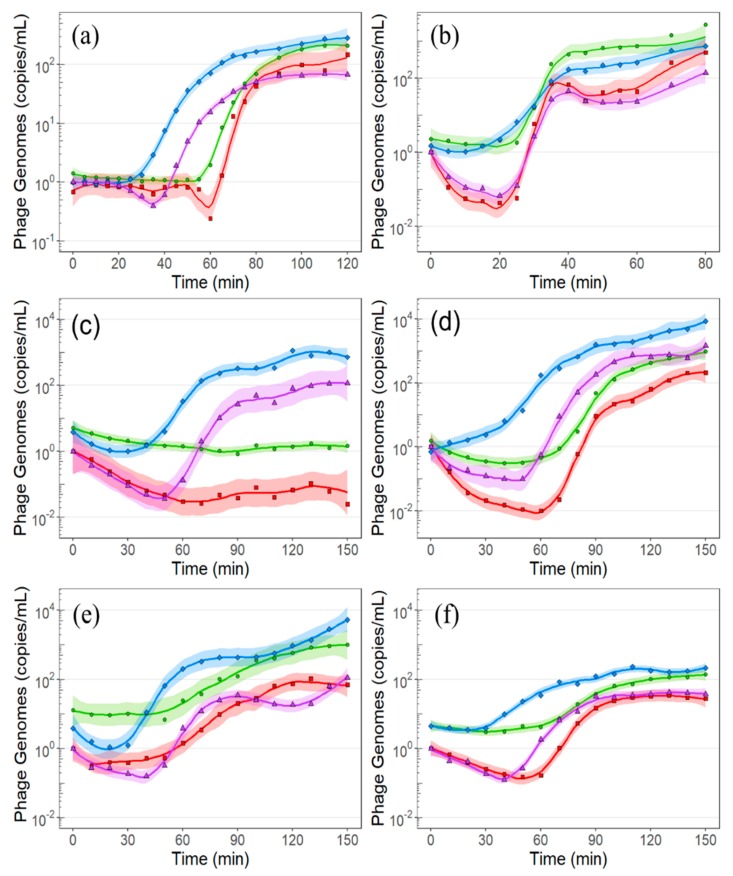
Figure 4.
Molecular profile of phage infection of the four genera of Erwinia phages in this study. (a) Infection of E. amylovora Ea6-4 by phage ΦEa21-4 at an multiplicity of infection (MOI) of 0.45. (b) Infection of E. amylovora EaD7 by phage ΦEa46-1-A1 at an MOI of 0.625. (c) Infection of E. amylovora Ea17-1-1 by phage ΦEa9-2 at an MOI of 0.015. (d) Infection of E. amylovora Ea273 by phage ΦEa9-2 at an MOI of 0.015. (e) Infection of P. agglomerans Pa39-7 by phage ΦEa35-70 at an MOI of 0.03. (f) Infection of P. agglomerans Pa39-7 by phage ΦEa35-70 at an MOI of 0.7. The symbols represent the mean of data produced in triplicate, the line is a local regression model of the data (LOESS), and the shaded area around the line represents a 95% confidence interval. MOIs were calculated using the qPCR data at t0. Here,  (blue diamond) = total number of phage genomes;
  (green circle) = total number of phage genomes in the supernatant;
  (purple triangle = total number of virions;
  (red square = total number of virions in the supernatant.

