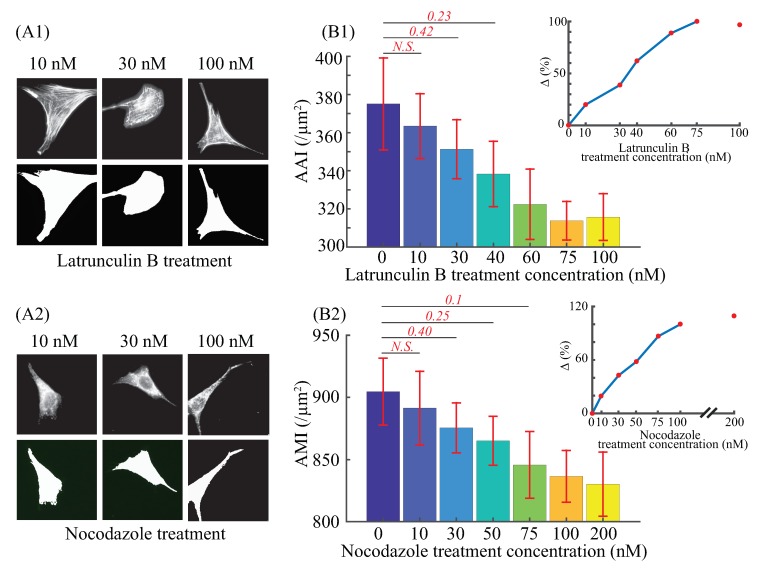
Figure 3.
Example F-actin and microtubule images of cells treated with (A1) latrunculin B and (A2) nocodazole, respectively, together with their corresponding detected cell area (lower rows, respectively). (B1,B2) are the AAI and the AMI together with their corresponding relative change , respectively. The error bars represent the standard errors. . Student’s t-test was performed to analyze the statistical difference: for each treatment concentration, data were compared with respect to the untreated ones. A was yielded for each comparison, unless otherwise denoted in the figure (with p values in red bold italic font).

