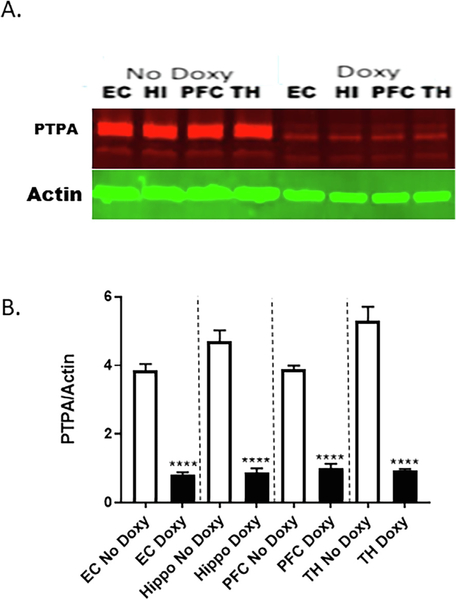
Fig. 6.
Suppression of PTPA protein in doxycycline-induced miR-34a expression in brain regions of transgenic mice. A. Representative western blots of PTPA expression among mice given Doxy vs No Doxy controls in the entorhinal cortex (EC), hippocampus (HI), prefrontal cortex (PFC), and thalamus (TH). B. Densitometric quantification of relative protein levels (PTPA/actin) is shown in the bar graph. Data are mean ± SEM, and the results shown are representative of three animals in each group. The significant Treatment × Region interaction [F(3,12) = 12.51, p < 0.005] was followed up with Bonferroni-corrected multiple comparisons of the effect of Treatment in each brain region, **** p < 0.0001.

