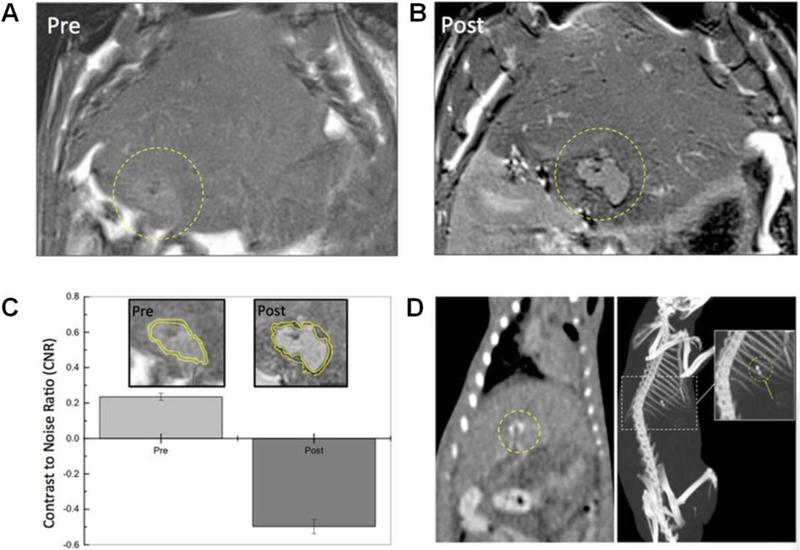
Figure 9.
T2-weighted MRI A) pre- and B) post- transcatheter intra-arterial infusion of nanocomposite microspheres consisting of gold nanorods and iron oxide coatings in a rat HCC model (yellow circle indicates tumor location), showing enhanced tumor edge contrast. C) contrast to noise ratio (CNR) of tumor margin before and after microspheres embolization. D) Whole body coronal CT (left panel) and three dimensional maximum intensity projection (right panel) image after nanocomposite microspheres embolization, with circles highlighting regions with enriched signal. Figure components adapted and reproduced with permission.[207c] Copyright 2016, Nature Publishing Group.

