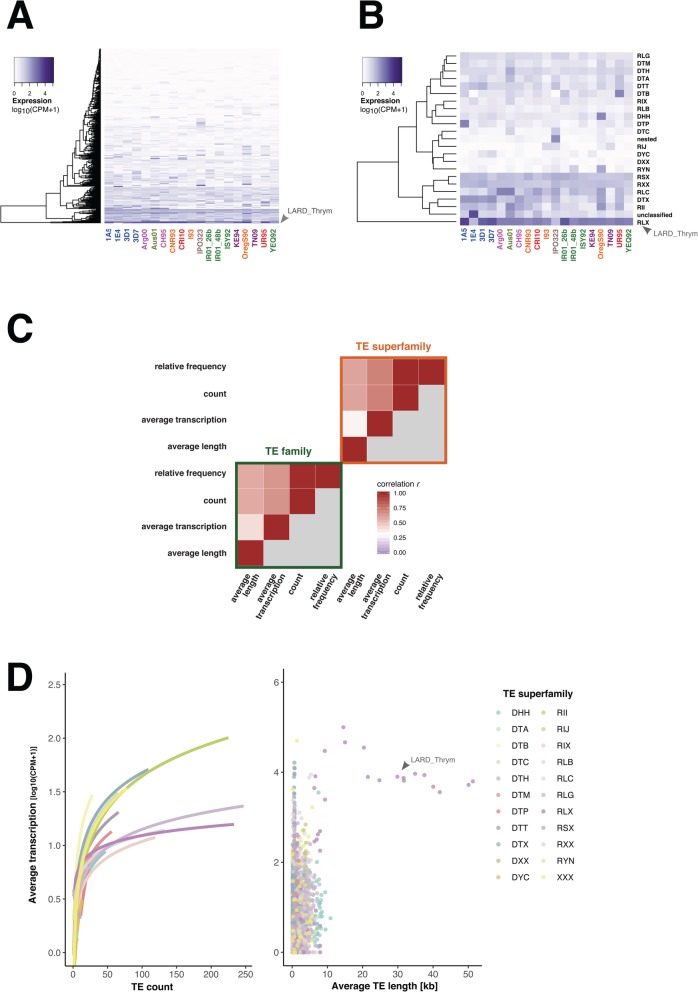
Fig. 6.
Transcriptional activity of transposable elements (TEs). a TE family transcription levels across all 19 genomes expressed as log10 (CPM + 1). b Average transcription levels of TE superfamilies across all genomes expressed as average log10 (CPM + 1). c Spearman correlation matrix of four TE metrics including counts, relative frequencies, average length and transcription both at the level of TE families and superfamilies. d Variation of TE transcription (average log10 (CPM + 1)) as a function of TE counts (left panel) or average TE length (right panel). Curves in the left panel show the logarithmic linear regression given by the linear model log10 (CPM + 1) ~ log10 (TE count). The highly expressed LARD_Thrym family (RLX) is highlighted using arrows (panels a, b and d)

