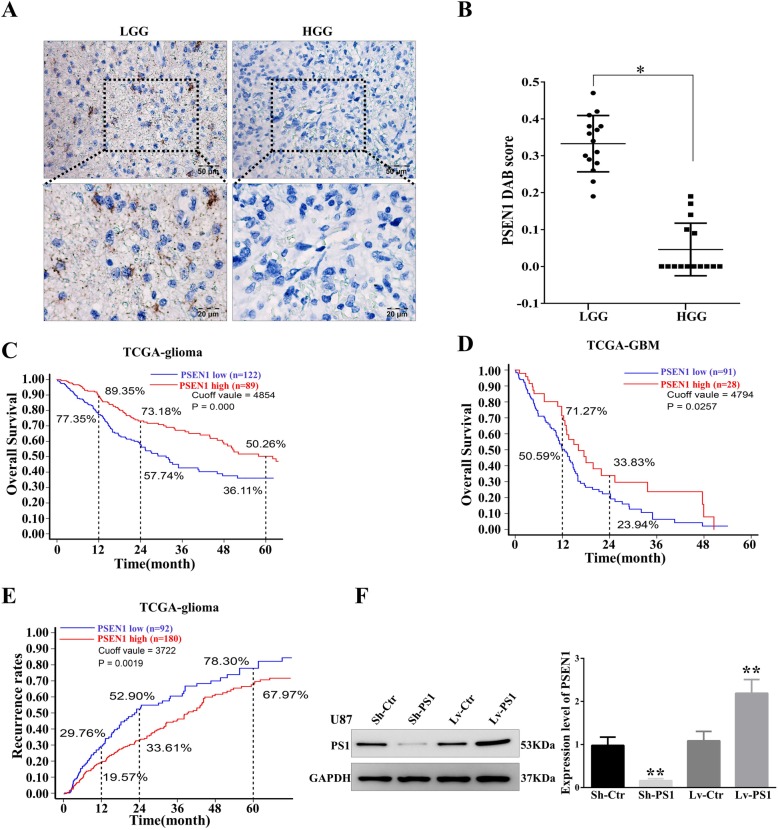
Fig. 1.
a Representative IHC staining of Presenilin1 protein in low grade glioma tissues (LGG, left panels) and high grade glioma tissues (HGG, right panels). Scale bars = 50 um and 20 um respectively. b Statistical analysis of the relative expression levels of Presenilin1 in LGG and HGG, * p < 0.05. c Kaplan-Meier analysis for all grade glioma patients, patients in the high Presenilin1 group (n = 122) and in the low Presenilin1 group (n = 89) (P = 0.0000, log-rank test). d Kaplan-Meier analysis for glioma patients. Patients in the high Presenilin1 group (n = 28) and in the low Presenilin1 group (n = 91) (P = 0.0257, log-rank test). e Kaplan-Meier analysis for all grade glioma patients. Patients in the high Presenilin1 group (n = 180) and in the low Presenilin1 group (n = 92) (P = 0.0019, log-rank test). f U87 cells were transfected with lentivirus contain sh-RNA target Presenilin1(sh-PS1) or full-length gene of Presenilin1(Lv-PS1).Sh-NC and Lv-NC were used as control, then Western-blot to detect the down- and over-expression effect of lentivirus in U87 cells, *p < 0.05,**p < 0.01

