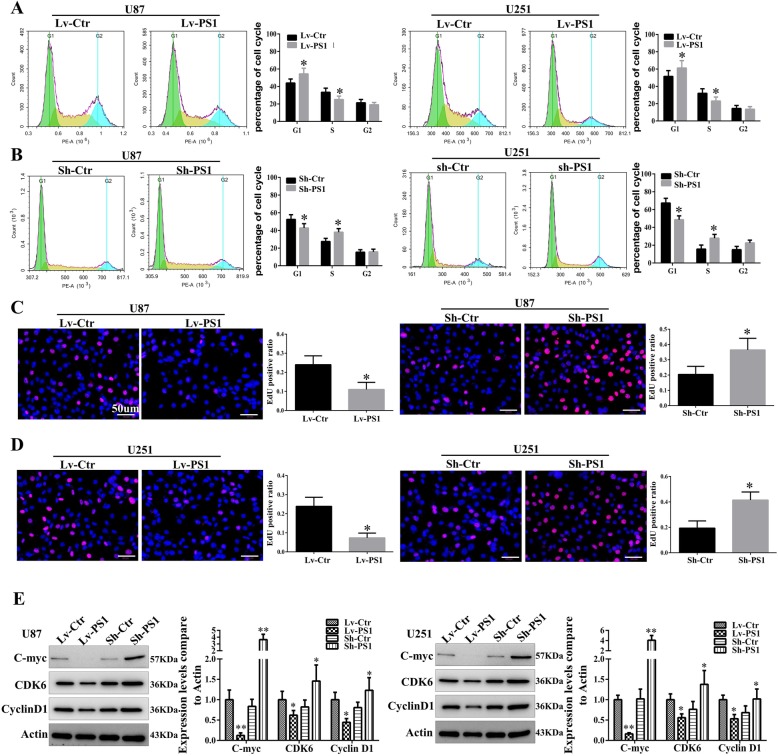
Fig. 3.
a U87 and U251 cells were over-expressed of Presenilin1, then were used to flow cytometry assays to analyse the cell cycle. Histograms showing the percent of cell at G1, S and G2 phase. b Flow cytometry assays were applied to investigate the influence of down expression of Presenilin1 on cell cycle in U87 and U251 cells. c Edu staining to show the proliferation states of U87 and U251 cells after Presenilin1 were up-regulated, histograms showing the Edu positive cell ratio in each groups, Scale bars = 50um. d Representative Edu images and histograms to show the influence of Presenilin1 repression on glioma proliferation, Scale bars = 50um. e Western-blot assays to show the expression of C-myc, CDK6 and CyclinD1 when Presenilin1 down- or up-regulation in U87and U251 cell. * p < 0.05,** p < 0.01

