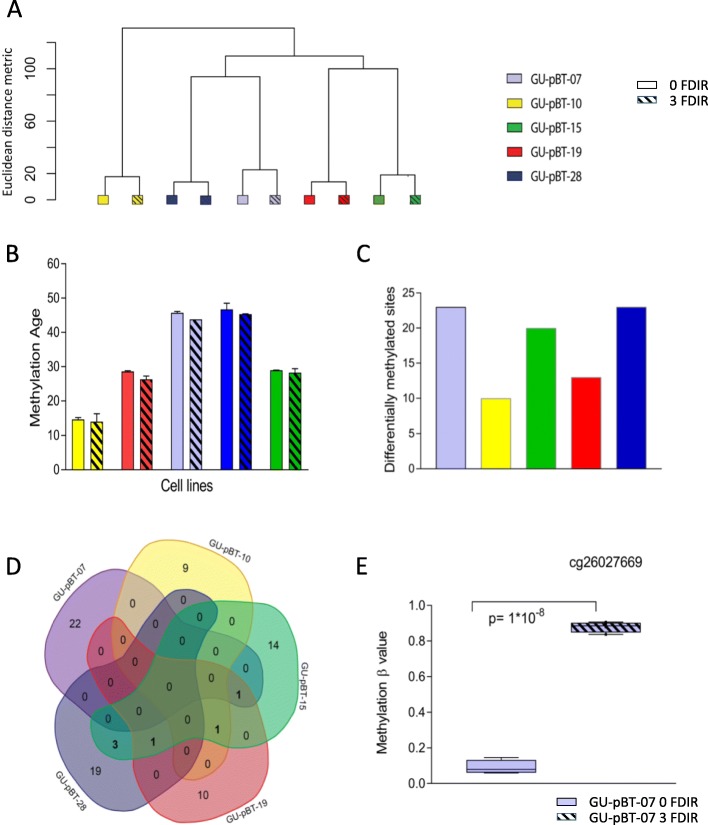
Fig. 3.
Genome-wide and site-specific methylation alterations following three FDIR of 2 Gy. a Unsupervised clustering and b DNA methylation age calculated with Horvath’s DNA methylation age calculator show that cells maintain their DNA methylation profiles of specific sites with radiation. Error bars represent standard error of mean, n = 2. c Number of differentially methylated positions (DMPs) detected in each cell line. d Venn diagrams depicting the overlapping DMPs between the cell lines. e A selected CpG site showing a change from unmethylated to methylated state following radiation at both early and late passages and at both 2 and 4 Gy

