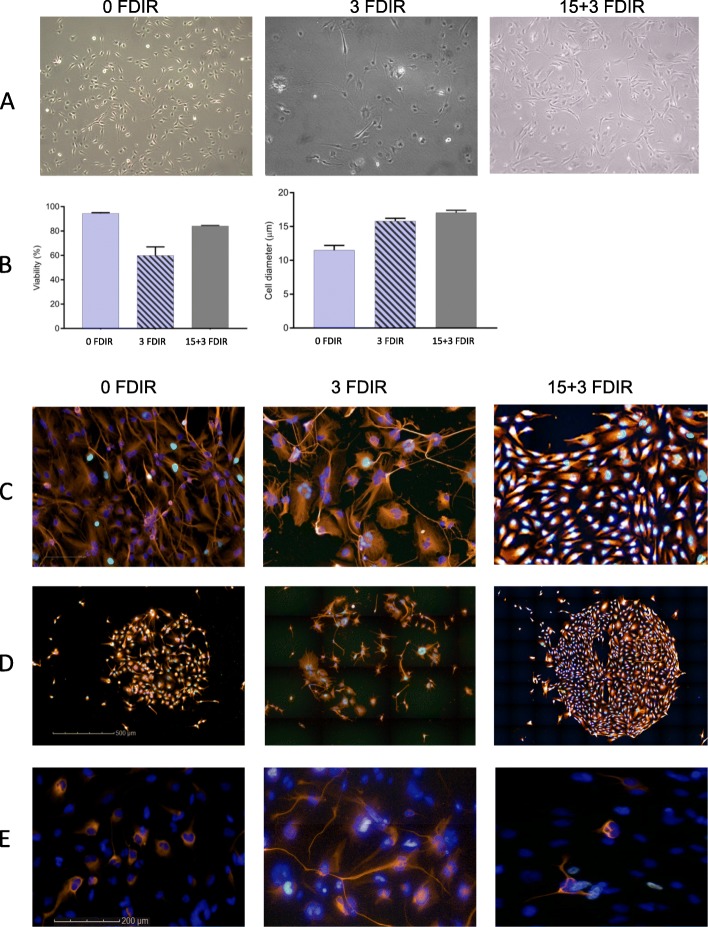
Fig. 6.
Radiation-induced morphological changes with increasing number of radiation fractions of 2 Gy. a Bright-field enlarged cells. b Percent of viable cells and cell diameter. c Immunocytochemistry showing cellular morphology with α-tubulin-stained cytoskeleton (orange), DNA-synthesizing cells by EdU incorporation (green) and nuclear staining with DAPI (blue). d Single-cell seeding after irradiation shows reduced clonogenic capacity after 3 fractions compared to unirradiated and 15 + 3 irradiated cells. e The frequency and staining pattern of GFAP varied between treatment groups

