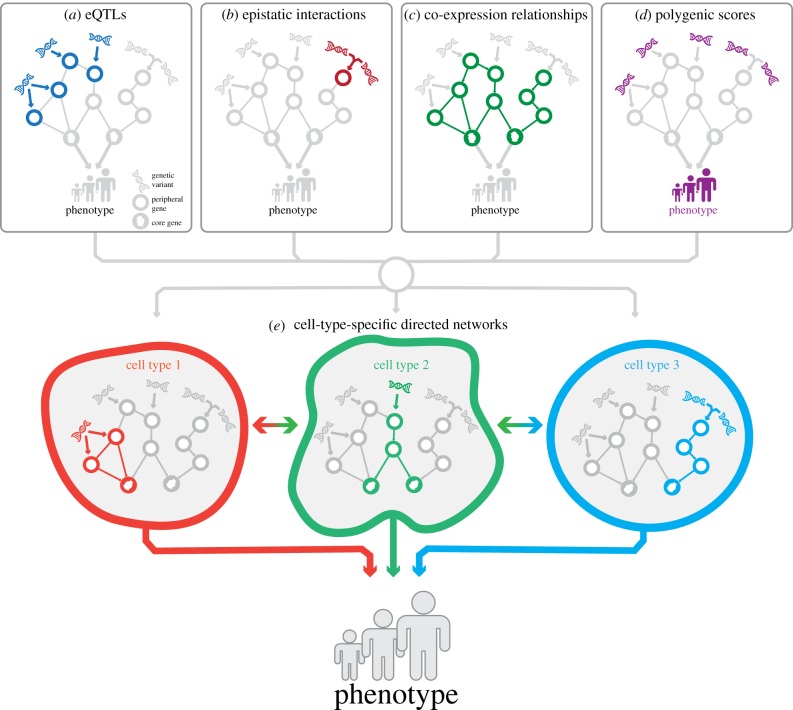
Figure 3.
Aspects of fine-mapping genes from GWAS loci. (a) Using eQTLs (dark blue) and CRISPRi/a-based assays, GWAS loci can be linked to genes when using the correct context. (b) Not every relationship between genetics and expression can be described additively. Epistatic effects (dark red) describe a relationship where two (or more) mutations are needed to arrive at the phenotype. (c) Using co-expression, regulatory relationships between genes can be quantified, but the specific role of genetics in these relationships is unknown. (d) Using PGSs, the joint effects of GWAS loci can be assessed, sacrificing resolution to obtain higher-level insights into the pathways affected by the genetics associated with a phenotype. (e) When assessed at single-cell resolution, the total network can be deconstructed into the cell-type relevant components. Affected cells can subsequently display an altered interaction with other cells within a tissue or individual, leading to a changed tissue- or individual-wide outcome for a phenotype.

