Fig. 5.
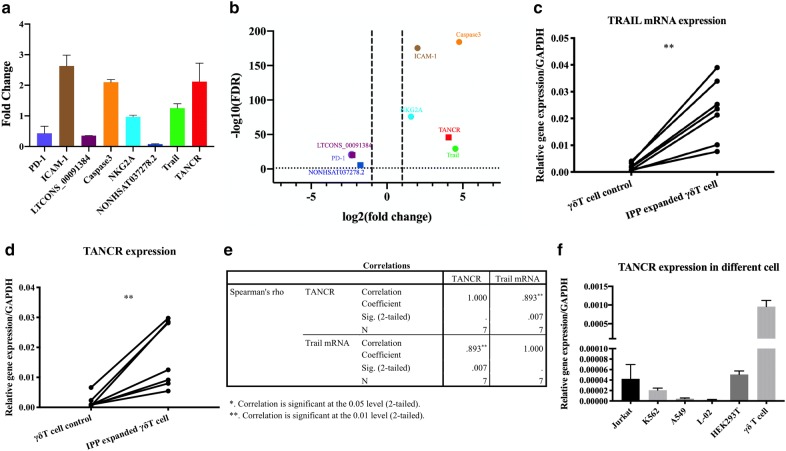
Expression of TANCR. a Validation of RNA-seq, qRT-PCR results of eight selected genes. b Volcano plots of eight selected genes in RNA sequencing results, thick vertical lines represent fold changes of ‒ 2 and + 2, while thick horizontal lines stand for negative log10 of FDR. TRAIL (c) and TANCR (d) expression in IPP-expanded γδ T cells, γδ T cell control represents γδ T cells without IPP treatment, qRT-PCR was normalized by GAPDH and p value was calculated by paired Student’s t-test, n = 7. e Spearman’s correlation analysis of TANCR and TRAIL mRNA expression. f TANCR expression in different cells. Data are represented as means ± SEM from three individual experiments, qRT-PCR was normalized by GAPDH

