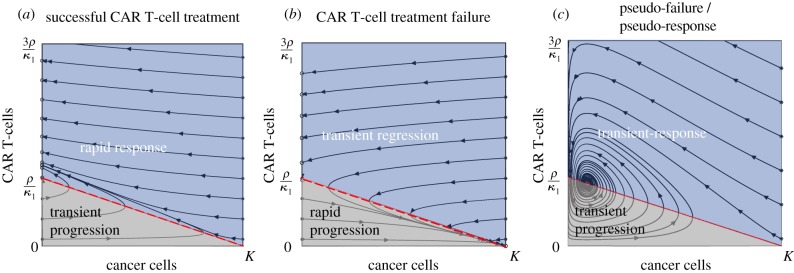
Figure 1.
Possible dynamics from the CARRGO model. Dynamics are represented as trajectories in a two-dimensional phase-space . (a) Case 1: successful CAR T-cell treatment (A = 0, B = 0.2). This situation predicts all long-term dynamics to result in eradication of cancer cells with varying levels of residual CAR T-cells. (b) Case 2: CAR T-cell treatment failure (A = 0, B = −0.2). This situation predicts all long-term dynamics to result in cancer cells growing to carrying capacity and eventual elimination of CAR T-cells. (c) Case 3: pseudo-failure/pseudo-response (A = 0.14, B = 1.6). This situation predicts long-term coexistence of cancer cells and CAR T-cells, denoted P3 (red circle). In this situation, cancer cell and CAR T-cell populations increase, then decrease, then increase in an oscillatory manner. The dark blue regions show cancer cell response and the light grey regions show cancer cell progression. We note that all three dynamics predicted by the CARRGO model include periods of transient increase or decrease in the cancer cell population, pointing to pseudo-progression of cancer, which is a critical challenge in CAR T-cell treatment. (Online version in colour.)

