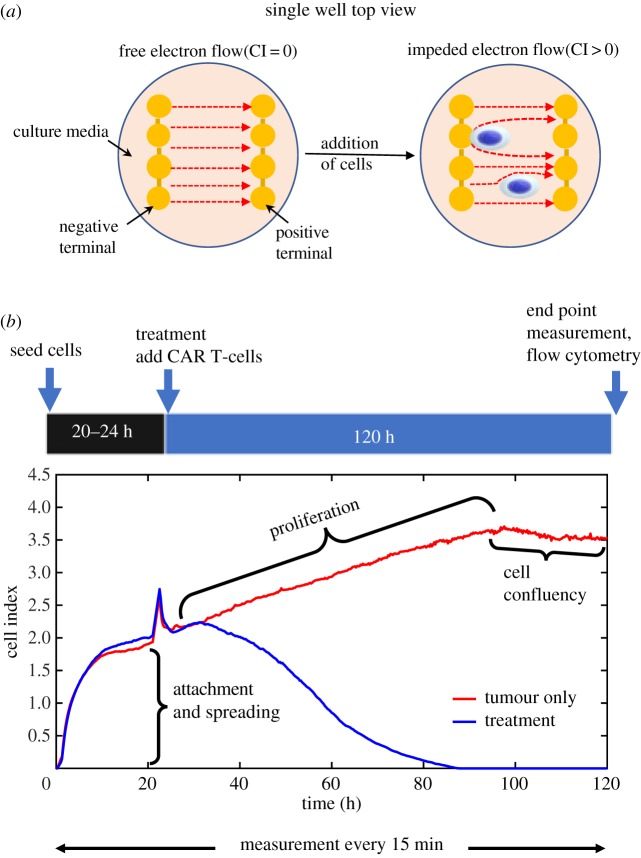
Figure 2.
Schematic of experiment design and output data from the xCELLigence system. (a) The xCELLigence system for real-time monitoring of cancer cell growth and response to CAR T-cell therapy. (b) The output of xCELLigence is ‘cell index’ (CI) which is calculated from changes in electrical impedance in the culture plate over time. Cell index is strongly correlated with the number of cells in the well/plate. This system results in distinct regimes of cell growth dynamics, including an attachment phase followed by proliferation and confluency. The spike in CI signal at 24 h is noise resulting from removing the plate from the incubator to add CAR T-cells. The proliferation growth regime was used to fit the CARRGO model and quantify dynamics of CAR T-cell killing of cancer cells (blue curve) when compared with untreated growth (red curve). (Online version in colour.)

