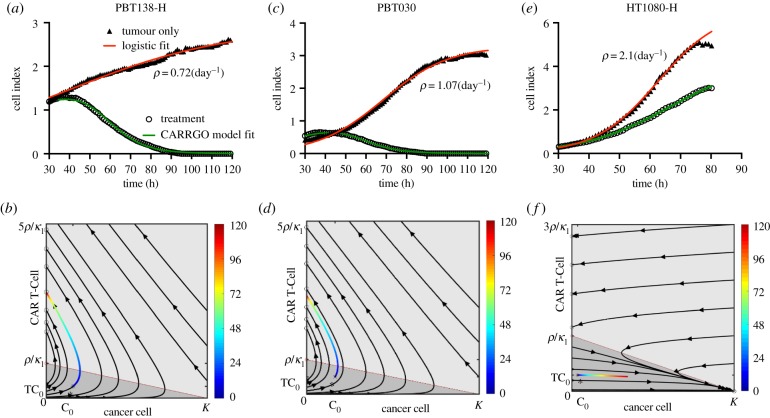
Figure 3.
CARRGO model dynamics and in vitro CAR T-cell and glioma cell data. Dynamics from three cancer cell lines with and without CAR T-cell treatment along with CARRGO model fits (red line: logistic growth; green line: CARRGO model) with effector to target ratio 1 : 20. Top row: cell index from xCELLigence and model fit. Bottom row: data of treatment dynamics plotted in phase-space coloured by time (hours). (a,b) PBT138, tumour seeding 12.5 × 10³ (cells), (c,d) PBT030, tumour seeding 12.5 × 10³ (cells), (e,f) HT1080 high, tumour seeding 2 × 10³ (cells). Estimated tumour growth rate for cell line PBT138-H was ρ = 0.72 day−1, for PBT030 was ρ = 1.07 day−1 and for HT1080-H was ρ = 2.1 day−1. PBT138-H and PBT030 show successful CAR T-cell killing. HT1080-H shows CAR T-cell exhaustion and treatment failure. These dynamics are captured in the phase-space diagrams and CARRGO model parameters, which correctly capture transient progression before response for PBT138 and PBT030 (case 1, figure 1) and rapid progression for HT1080-H (case 2, figure 1). (Online version in colour.)

