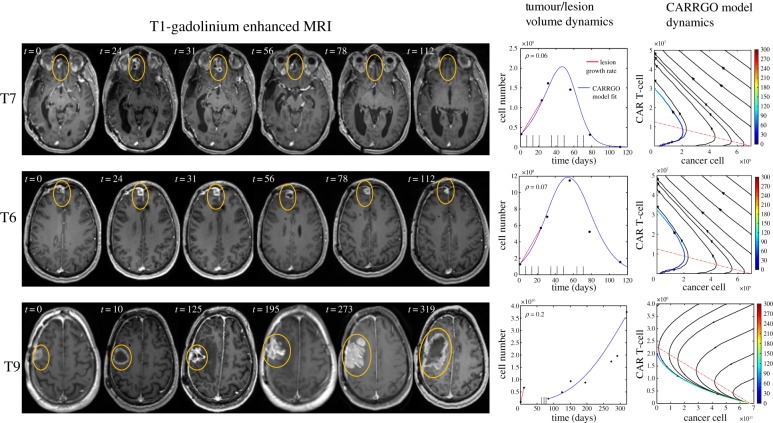
Figure 6.
CARRGO model applied to in vivo human data. A male patient with multi-focal glioblastoma was treated with IL13Rα2 CAR T-cells. Yellow circles are used to indicate tumour location and do not reflect tumour size. Cell number is calculated from tumour size with volumetric segmentation of the contrast-enhancing lesion. The right columns show CARRGO model fits and dynamics based on the tumour volume data. The CARRGO model parameters are the same for lesions T7 and T6, which responded to CAR T-cell treatment. The model predicts that the non-responding lesion T9 had a smaller rate of CAR T-cell killing and increased rates of exhaustion and CAR T-cell death. Lesion T9 was also observed to have a higher cancer cell proliferation rate (ρ = 0.2 day−1) when compared with T6 and T7 which had very similar rates (ρ = 0.06 and 0.07 day−1, respectively). (Online version in colour.)

