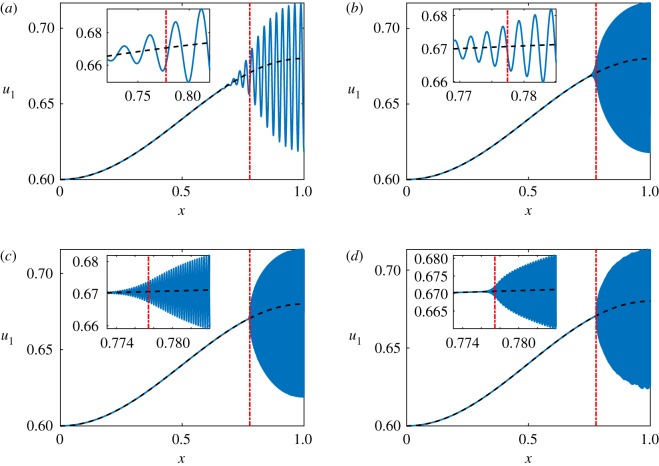
Figure 2.
Plots of u1 from simulations of the Schnakenberg system using α = 1, d = 1/40 = 0.025, and β = 3/5 + [1 − cos (πx)]/25 with varying ε. The blue solid curve is from the numerical simulation whereas the black dashed curve is the stationary state (note that the blue region is due to the highly oscillatory nature of the solution). The red dash-dotted curve is the boundary of at x ≈ 0.7774 (i.e. the singular point ). The insets show a zoomed-in region near the boundary of ; these insets are over different regions in (a) and (b), though (c) and (d) share the same x-axis for their insets. (a) ε = 10−2, (b) ε = 10−3, (c) ε = 10−4, (d) ε = 10−5. (Online version in colour.)

