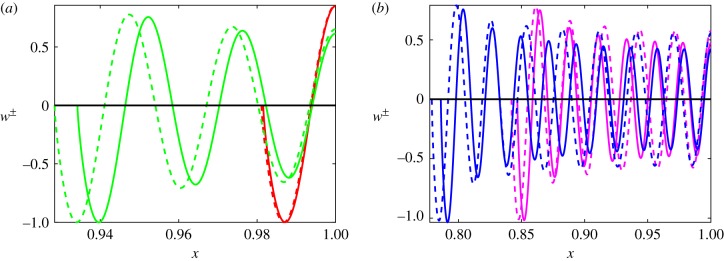
Figure 6.
We plot the first component of modes given by (3.16b), associated with u1, corresponding to parameters as in figure 2a. We plot modes for the positive branch (solid lines), with n+ = 1, 5, 13, 19 in red, green, purple and blue, respectively, as well as the modes corresponding to the negative branch (dashed lines), with n− = 1, 5, 11, 15 in red, green, purple, and blue respectively. The smaller two mode numbers are shown in (a), and the larger two in (b). We remark that the smallest and largest values of n± correspond to the maximal and minimal mode numbers along each branch, and the other two mode numbers for each branch are chosen to have similar values of λ. Note the shrinkage of the support of each mode with increasing n, and in particular the difference in the axes for each plot. (Online version in colour.)

