Figure 3.
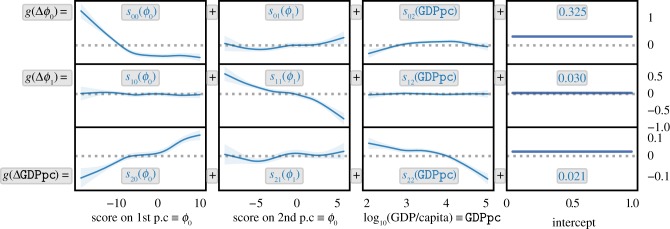
Export baskets tend to diversify and converge to a balance of agriculture and manufactured goods. Shown are partial dependence plots of the three equations in (1.2). Each blue (solid) curve is an additive contribution to the quantity written in black on the left-hand side of this figure, which is a link function g applied to the expected yearly change in one of the three variables ϕ0, ϕ1, . (See the text after (1.2) for the definition of g.) In each plot, the quantity being plotted is written in blue within the plot. Adding the blue expressions across a row gives the right-hand sides of (1.2). The shaded regions show the 95% CI. Each equation has an intercept, ci, shown in the right column. The plots on the diagonal have negative trends, suggesting convergence. Interestingly, income is not associated with changes in export baskets, but ϕ0 appears to drive : diversifying precedes income growth. (Replacing ϕ0 with diversification preserves the positive trend in the bottom-left plot, but replacing it with per capita exports greatly weakens that relationship; see electronic supplementary material, Figs. SM-13 and SM-14.) (Online version in colour.)

