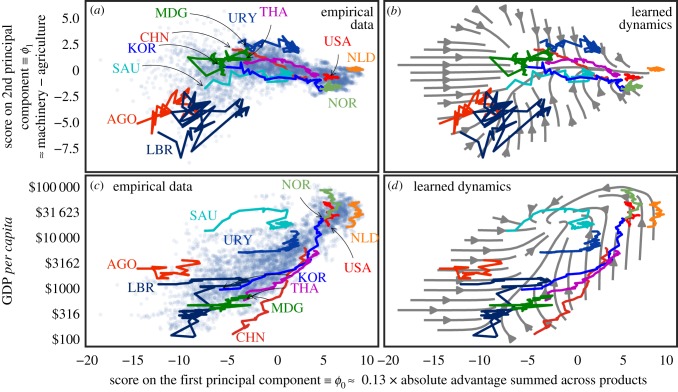
Figure 4.
The learned dynamics (1.2) predict that countries are converging. The left column shows empirical data with blue dots; the right column shows predictions of the model (1.2) as stream plots. The empirical trajectories of eight countries over years 1962–2016 are superimposed on all four plots. Trajectories are labelled at the first available sample (year 1985 for Angola, 1962 for the rest). A country is represented by a triple , and the model (1.2) has been trained on this three-dimensional space, but here we show projections onto (ϕ0, ϕ1) in the top row and onto in the bottom row. (a) Countries tend to diversify (increase ϕ0) and strike a balance between machinery and agriculture (ϕ1 ≈ 0). (c) Development success stories (e.g. THA, KOR, CHN) share a common trajectory of increasing ϕ0 and income. (d) Poor countries may follow in their footsteps, but income in the richest countries may stagnate or even fall. Countries are labelled with United Nations ISO-alpha3 codes. (Online version in colour.)

