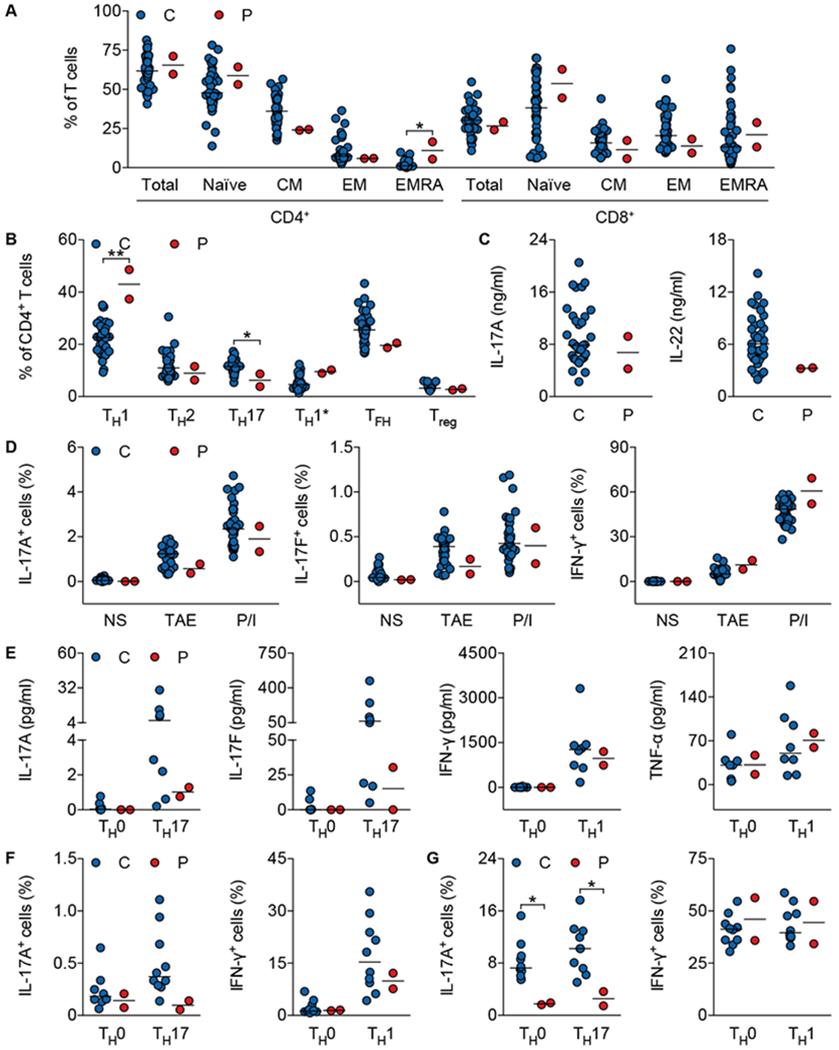
Fig. 4. Compromised T-cell differentiation in the patients.

(A) Percentage of total, naïve (CCR7+CD45RA+), central memory (CM; CCR7+CD45RA−), effector memory (EM; CCR7−CD45RA−), or CD45RA+ effector memory (EMRA; CCR7−CD45RA+) CD4+ and CD8+ T cells from healthy controls (n=40) and patients (P2 and P3). (B) Frequency of TH1 (CXCR5−CXCR3+CCR6−), TH2 (CXCR5−CXCR3−CCR6−CCR4+), TH17 (CXCR5−CXCR3−CCR6+CCR4+), TH1* (CXCR5−CXCR3+CCR6+CCR4+), TFH (CXCR5+), and Treg (CD25+FOXP3+) subsets among CD4+ T cells from healthy controls (TH1, TH2, TH17, TH1*, and TFH, n=34; Treg, n=17) and patients (P2 and P3). (C) Production of IL-17A and IL-22 by whole blood from healthy controls (n=33) and patients (P2 and P3) after stimulation with PMA plus ionomycin for 24 h. (D) Percentage of IL-17A+, IL-17F+, and IFN-γ+ cells among memory CD4+ T cells from healthy controls (n=36) and patients (P2 and P3) activated by T-cell activation and expansion (TAE) beads or PMA plus ionomycin (P/I) for 12 h. (E) Cytokine production by naïve CD4+ T cells from healthy controls (n=8) and patients (P2 and P3) cultured under TH0-, TH17- or TH1-polarizing conditions. (F and G) Frequency of IL-17A+ and IFN-γ+ cells among naïve (F) and memory (G) CD4+ T cells from healthy controls (n=10) and patients (P2 and P3) cultured under TH0-, TH17- or TH1-polarizing conditions. C, Healthy controls; P, P2 and P3. Horizontal bars represent median values (A-G). *, P < 0.05 and **, P < 0.01; in two-tailed Mann-Whitney tests (A-G).
