
Graph 1.
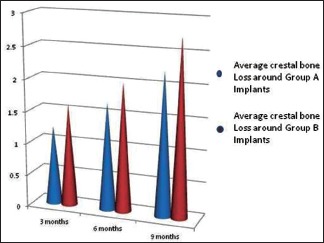
Showing the average crestal bone loss around the perimeter of Group A and B implants
Official websites use .gov
A
.gov website belongs to an official
government organization in the United States.
Secure .gov websites use HTTPS
A lock (
) or https:// means you've safely
connected to the .gov website. Share sensitive
information only on official, secure websites.
Showing the average crestal bone loss around the perimeter of Group A and B implants