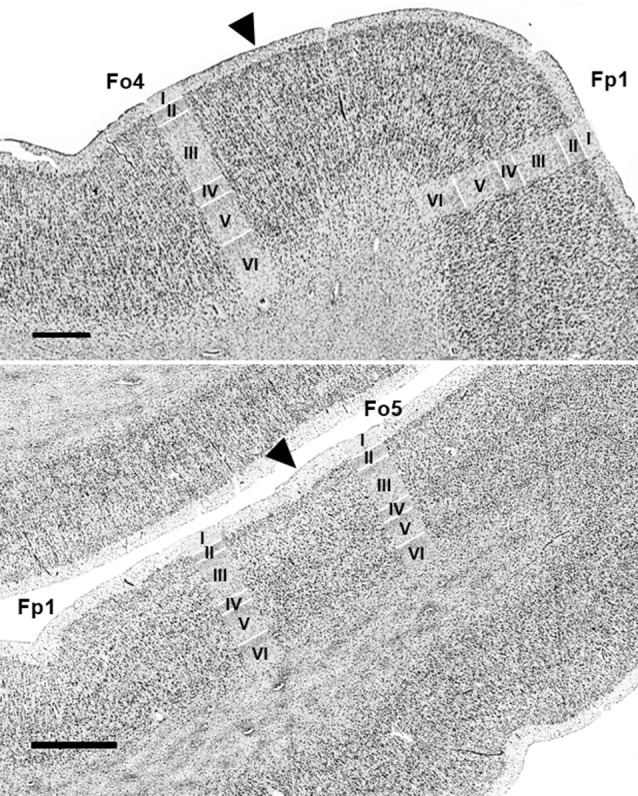
Figure 5.

Cytoarchitectonic borders of Fp1 with Fo4 (upper panel) and Fp1 with Fo5 (lower panel). Arrowheads indicate borders between areas. Scale bars = 1 mm. Images come from the BigBrain, a high-resolution whole-brain model of the human brain, which can be found at: https://bigbrain.humanbrainproject.org/ (Amunts et al., 2013).
