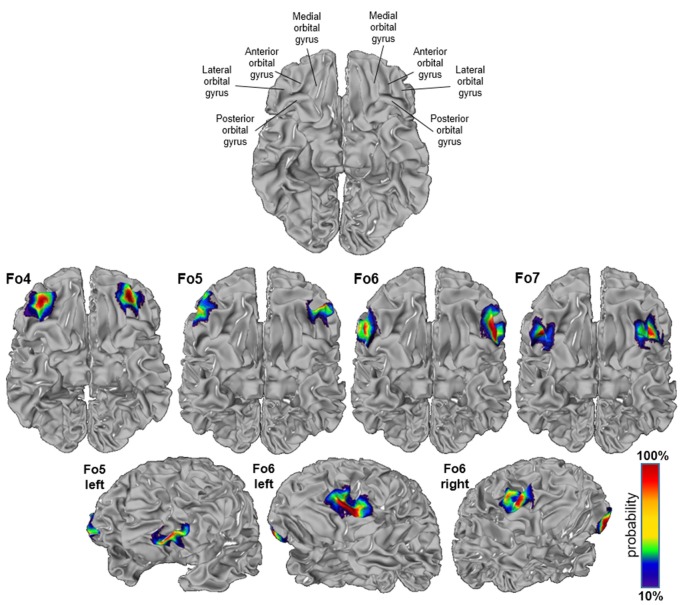
Figure 8.
Probability maps registered to the anatomical Montreal Neurological Institute (MNI) anatomical reference brain “Colin27”; inflated version (JuBrain atlas: https://jubrain.fz-juelich.de/apps/cytoviewer/cytoviewer.php. Ventral views of areas Fo4–Fo7 (upper panels) and lateral views of Fo5 and Fo6 (lower panels). The probability is color-coded (red = full overlap of all 10 brains, dark blue = only one brain).

