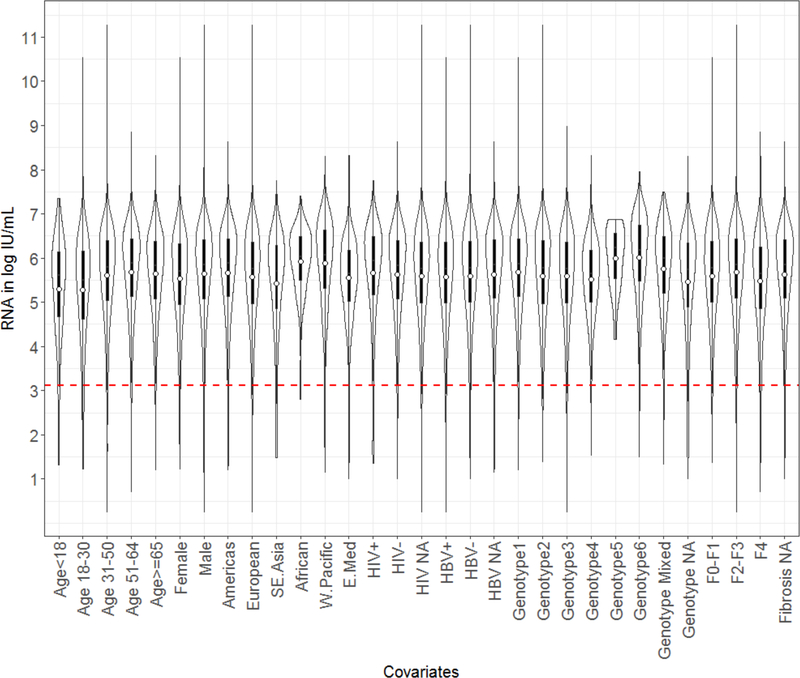
Figure 2.
Violin plot of the HCV RNA distribution (log10 IU/mL) for each covariate in the total population cohort. In each violin plot, a circle denotes the median and the interquartile range is shown by box in solid black. Overlaid on this box plot is a kernel density plot indicating more data where the plot is thicker and less where it narrows. The dashed horizontal marker indicates the 1318 IU/mL level of detection derived from the HCV RNA frequency distribution.

