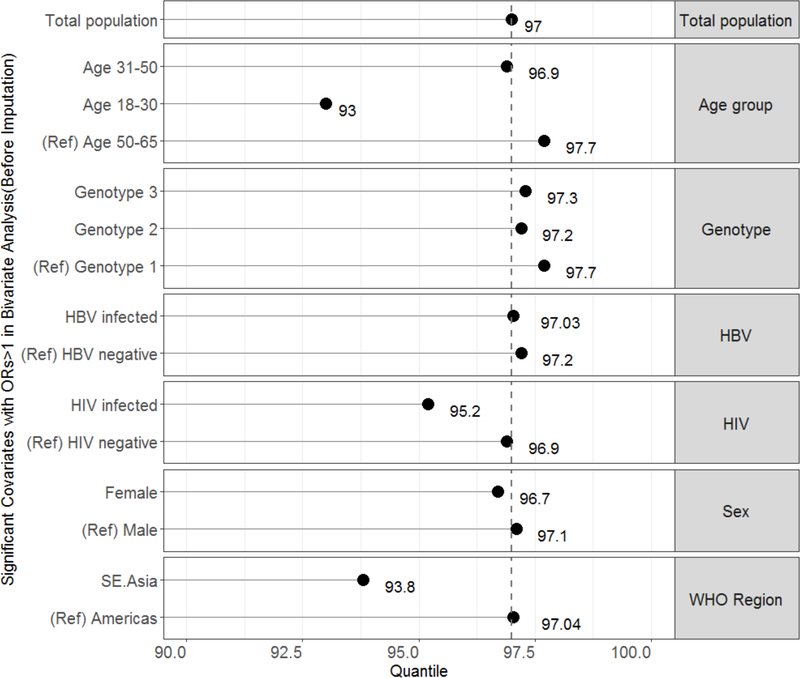
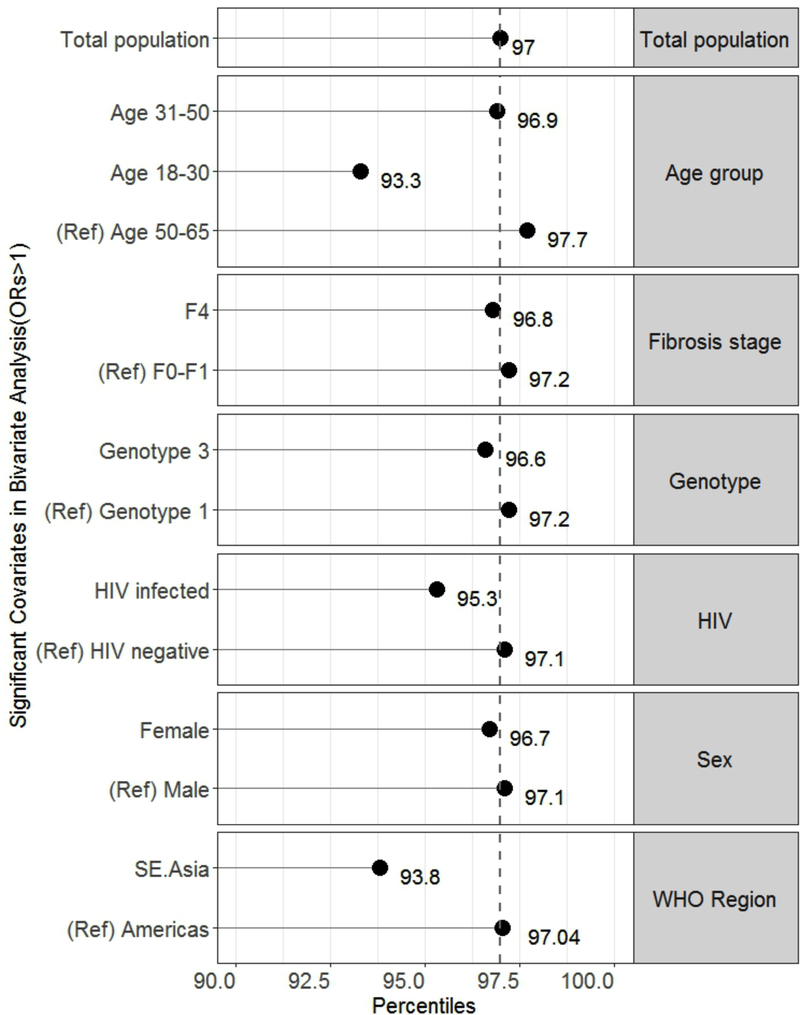
Figure 3.
Graph of relative percentiles of HCV viraemia corresponding with the limit of detection derived from the total population dataset (1318 IU/mL) for covariates significantly associated with low-level viraemia in the (A) total population dataset and (B) imputed dataset. The reference (ref) groups are included for each category. The dashed vertical line marks the 97th percentile from the total population dataset.


