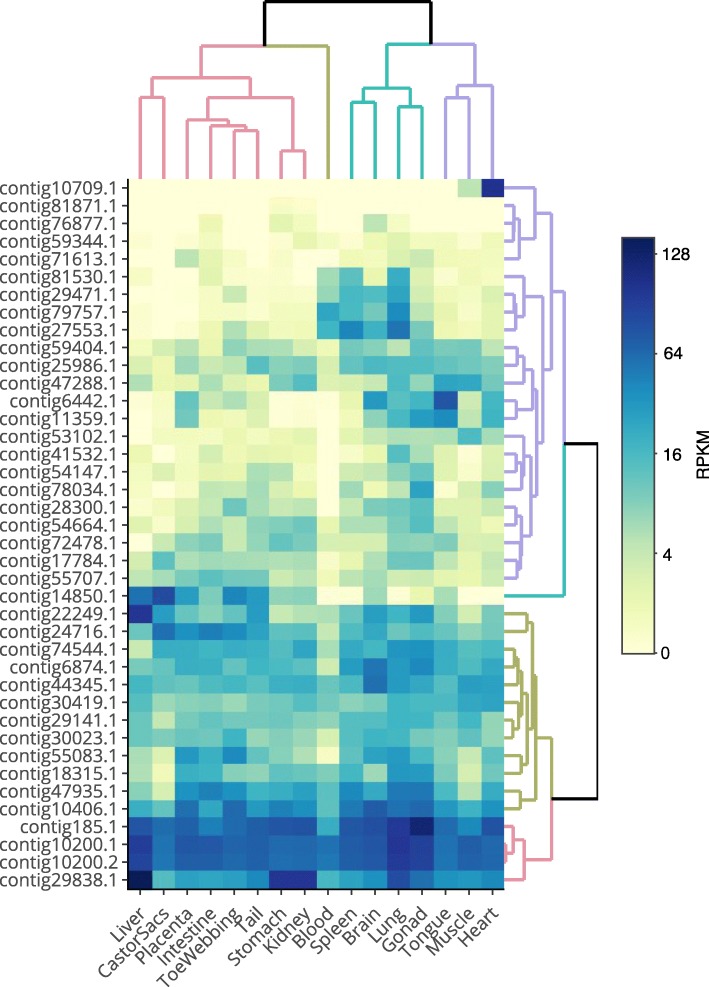
Fig. 6.
Tissue-specific expression of beaver lncRNAs that are orthologous to known noncoding transcripts. Heatmap rows correspond to the 40 contigs and columns correspond to the 16 tissues that were profiled. Cells are colored by log2(1 + RPKM) expression level. Rows and columns are separately ordered by hierarchical agglomerative clustering and cut-based sub-dendrograms are colored (arbitrary color assignment to sub-clusters) as a guide for visualization. Rows are labeled with abbreviated contig names, e.g., contig29838.1 instead of Ccan_OSU1_lncRNA_contig29838.1

