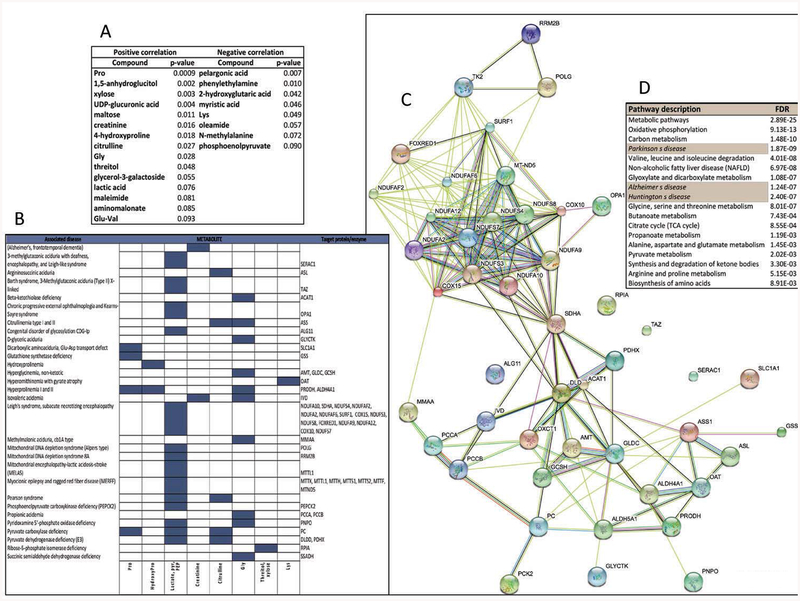
Figure 5. Correlation of plasma metabolites with CGG repeats and identification of the associated biological, cellular and molecular pathways.
A. List of plasma metabolites that showed a linear correlation with CGG expansion with the corresponding p values. More detailed information on the linear regression analysis is presented in the Supplementary Material. B. Prediction of enzyme or protein targets for those metabolites shown under panel A, whose concentrations were either elevated or reduced in plasma of genetic disorders listed under OMIM, Rare Metabolic Disease, HMDB, and Metagene databases. Rows represent disorders and columns represent the metabolites. If known, the causative gene’s name is indicated on the right. C. Using the putative targets identified under panel B as input data, a protein-protein interaction network was built with STRING. The interactions included both direct (physical) and indirect (functional) associations; they stem from computational prediction, from knowledge transfer between organisms, and from interactions aggregated from other (primary) databases. Detailed information of the analysis based on gene ontology for molecular function, biological process, cellular component and pathways is shown in Supplementary Material. D. The network generated under Panel C was used to generate a pathway analysis with the KEGG database. On the table it is shown the pathway/disease name (left) and false discovery rate (right).

