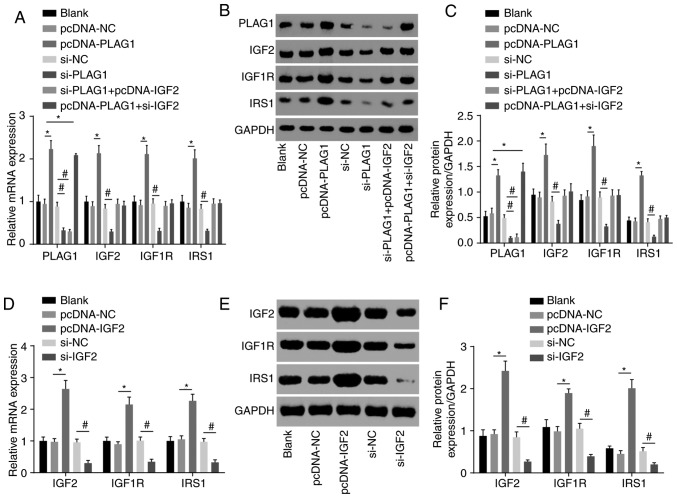
Figure 5.
PLAG1 overexpression activates the IGF2 signaling pathway. PLAG1, IGF2, IGF1R and IRS1 (A) mRNA levels, (B) western blot images and (C) quantification in A2780 transfected with pcDNA-PLAG1, si-PLAG1, si-PLAG1 + pcDNA-IGF2 and pcDNA-PLAG1 + si-IGF2 or associated controls. IGF2, IGF1R and IRS1 (D) mRNA levels, (E) western blot images and (F) protein levels in A2780 transfected with pcDNA-IGF2 and si-IGF2 or respective controls. Data are expressed as the mean ± standard error; each experiment was repeated three times. *P<0.05 vs.pcDNA-NC; #P<0.05 vs. si-NC. PLAG1, pleomorphic adenoma gene 1; IGF2, insulin-like growth factor-2; IGF1R, insulin-like growth factor 1 receptor; IRS1, insulin receptor substrate 1; si, small interfering RNA; NC, negative control.

