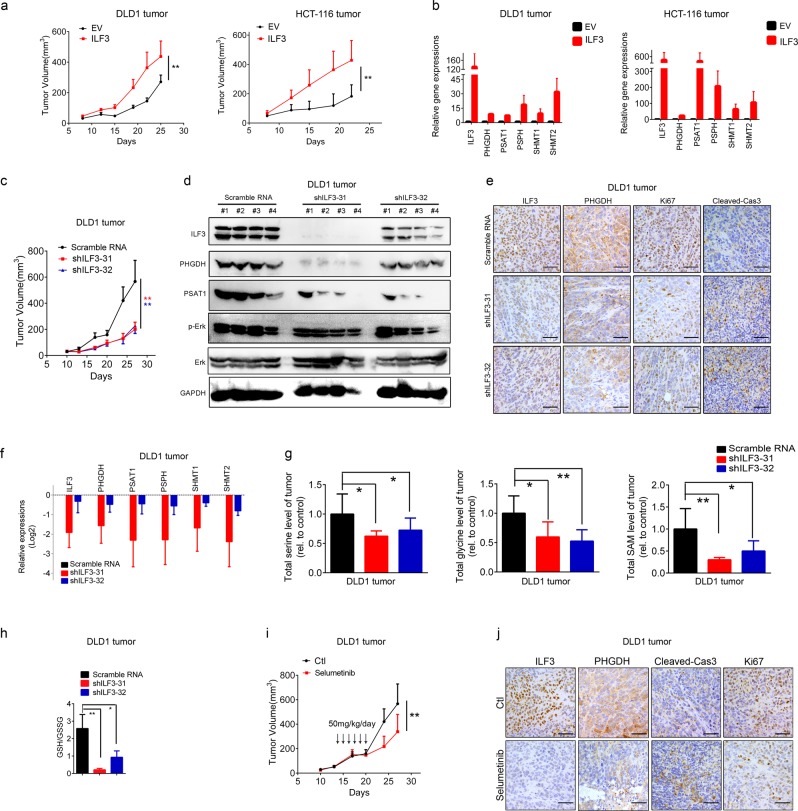
Fig. 6.
ILF3 promotes tumor growth in vivo. a Tumor growth curves of DLD1 (1 × 10⁶) or HCT-116 (1 × 10⁶) colon cancer cells with or without ILF3 overexpression. Cells were subcutaneously injected into nude mice (n = 6). The tumors were isolated at the end of the experiments. b Serine pathway gene expression in the tumor tissues of (a). qRT-PCR analysis was performed to measure the mRNA levels of serine biosynthesis pathway genes. c Measurement of the subcutaneous tumor growth of ILF3-KD DLD1 cells (1 × 10⁷). n = 9/group. The data are presented as the means ± SD. d Immunoblot analysis of protein levels of ILF3, p-Erk, Erk, PHGDH and PSAT1 in the subcutaneous tumor tissues generated in (c). e Representative IHC images of ILF3, PHGDH, Ki-67 and cleaved-Caspase-3 staining in the subcutaneous tumor tissues generated in (c). Scale bars represent 50 μm. f SGOC pathway gene expression after ILF3 KD in subcutaneous tumor tissues generated in (c). The data are presented as the means ± SD. g Measurement of SGOC pathway metabolites in subcutaneous tumor tissues obtained from (c). The data are presented as the means ± SD. *P < 0.05; **P < 0.01. h Relative ratios of reduced to oxidized glutathione (GSH/GSSG) in subcutaneous tumor tissues from (c) determined by LC–MS/MS. i Tumor growth curves of tumors derived from DLD-1 cells that were subcutaneously injected into nude mice (n = 6). Mice were treated with or without indicated amount of selumetinib. Tumor growth curves are shown. The data are presented as the means ± SD. j Representative IHC staining for ILF3, PHGDH, Ki-67 and cleaved-Caspase-3 in tumor tissues from (h). Scale bars represent 50 μm.

