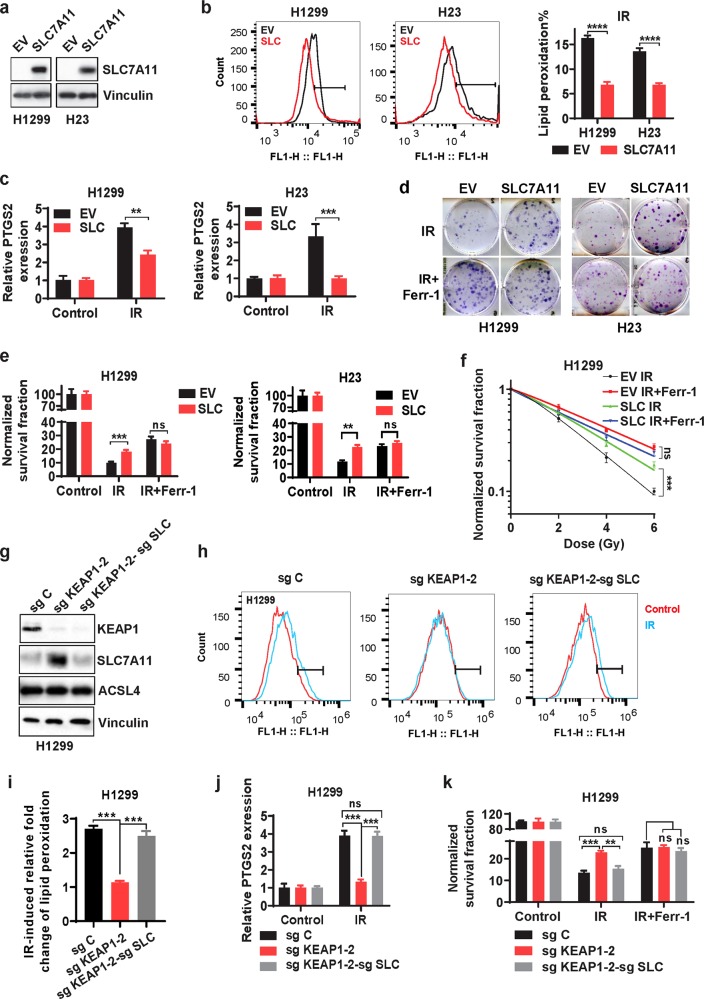
Fig. 3. SLC7A11 overexpression or KEAP1 deficiency promotes radioresistance largely through inhibiting ferroptosis.
a Western blotting analysis showing SLC7A11 levels in H1299 and H23 cell lines with stable expression of empty vector (EV) and SLC7A11. b Lipid peroxidation assessment in EV- and SLC7A11-expressing H1299 or H23 cells at 24 h after exposure to 6 Gy or 2 Gy of IR, respectively. Bar graph showing the relative levels of lipid peroxidation by C11-BODIPY staining in the indicated cells. Error bars are means ± SD, n = 3 independent repeats. P values were calculated using two-tailed unpaired Student’s t-test. c qRT-PCR analysis of PTGS2 expression in EV- and SLC7A11-expressing H1299 or H23 cells at 24 h after exposure to 6 Gy or 2 Gy of IR, respectively. Error bars are means ± SD, n = 3 independent repeats. P values were calculated using two-tailed unpaired Student’s t-test. d Representative images of clonogenic survival assays in EV- and SLC7A11-expressing H1299 or H23 cells that were pretreated with 5 μM ferrostatin-1 or DMSO for 24 h followed by exposure to 6 Gy or 2 Gy of IR, respectively. e The quantified clonogenic survival assay in EV- and SLC7A11-expressing H1299 or H23 cells that were pretreated with 5 μM ferrostatin-1 or DMSO for 24 h followed by exposure to IR at a dose of 6 Gy or 2 Gy, respectively. Error bars are means ± SD, n = 3 independent repeats. P values were calculated using two-tailed unpaired Student’s t-test. f The quantified clonogenic survival curve in EV- and SLC7A11-expressing H1299 cells that were pretreated with 5 μM ferrostatin-1 or DMSO for 24 h followed by exposure to IR at the indicated doses. Error bars are means ± SD, n = 3 independent repeats. P values were calculated using multiple t-test. g Western blotting analysis of KEAP1, SLC7A11 and ACSL4 expression in sg Control (sg C), sg KEAP1-2, and sg KEAP1-2-sg SLC7A11 (sg SLC) H1299 cell lines. h, i Lipid peroxidation assessment in sg C, sg KEAP1-2, and sg KEAP1-2-sg SLC H1299 cells at 24 h after exposure to 6 Gy of IR h. Bar graph showing IR-induced relative fold changes of lipid peroxidation by C11-BODIPY staining in the indicated cells (i). Error bars are means ± SD, n = 3 independent repeats. P values were calculated using two-tailed unpaired Student’s t-test. j qRT-PCR analysis of PTGS2 expression in sg C, sg KEAP1-2, and sg KEAP1-2-sg SLC H1299 cells at 24 h after exposure to 6 Gy of IR. Error bars are means ± SD, n = 3 independent repeats. P values were calculated using two-tailed unpaired Student’s t-test. k Clonogenic survival assays in sg C, sg KEAP1-2, and sg KEAP1-2-sg SLC H1299 cells that were pretreated with 5 μM ferrostatin-1 or DMSO for 24 h followed by exposure to 6 Gy of IR. Error bars are means ± SD, n = 3 independent repeats. P values were calculated using two-tailed unpaired Student’s t-test.

