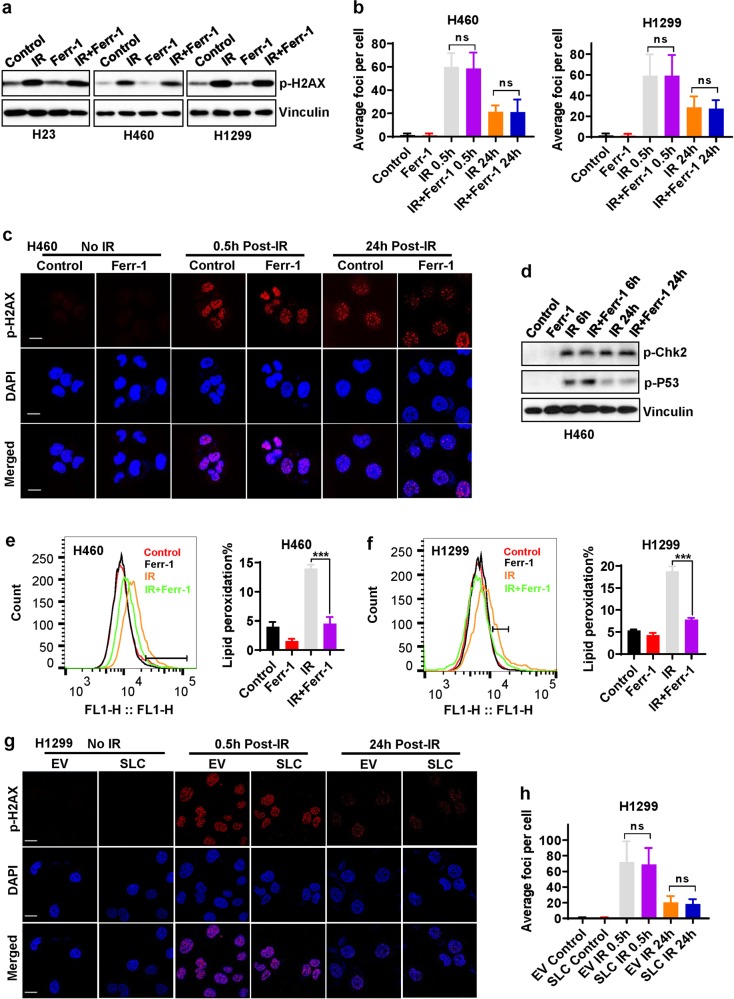
Fig. 4. Ferroptosis is not involved in IR-induced DNA damage and repair.
a Western blotting analysis of phospho-H2AX levels in H460, H1299, and H23 cell lines pretreated with DMSO (control) or 5 μM ferrostatin-1 for 24 h followed by exposure to IR at a dose of 6 Gy (for H460 and H1299 cells) or 2 Gy (for H23 cells). b The numbers of phospho-H2AX foci per nucleus were counted on the basis of phospho-H2AX immunofluorescence at 30 min or 24 h after exposure to 6 Gy of IR in cells that had been pretreated with DMSO or 5 μM ferrostatin-1 for 24 h. Error bars are means ± SD, n = 20 independent repeats. P values were calculated using two-tailed unpaired Student’s t-test. c Representative immunofluorescence images showing staining of phospho-H2AX foci (red) and nuclei counterstained with DAPI (blue) in the indicated cells. d Western blotting analysis of phospho-Chk2 and phospho-p53 levels in H460 cells pretreated with DMSO or 5 μM ferrostatin-1 for 24 h followed by exposure to 6 Gy of IR. e, f Lipid peroxidation assessment in H460 (e) and H1299 cells (f) pretreated with DMSO or 5 μM ferrostatin-1 for 24 h followed by exposure to 6 Gy of IR. Bar graph showing relative levels of lipid peroxidation by C11-BODIPY staining in the indicated cells. Error bars are means ± SD, n = 3 independent repeats. P values were calculated using two-tailed unpaired Student’s t-test. g Representative immunofluorescence images showing staining of phospho-H2AX foci (red) and nuclei counterstained with DAPI (blue) in the indicated cells with or without exposure to IR. h The numbers of phospho-H2AX foci per nucleus were counted on the basis of immunofluorescence at 30 min or 24 h after exposure to 6 Gy of IR in H1299 cells with stable expression of empty vector (EV) or SLC7A11 (SLC). Error bars are means ± SD, n = 50 independent repeats. P values were calculated using two-tailed unpaired Student’s t-test.

