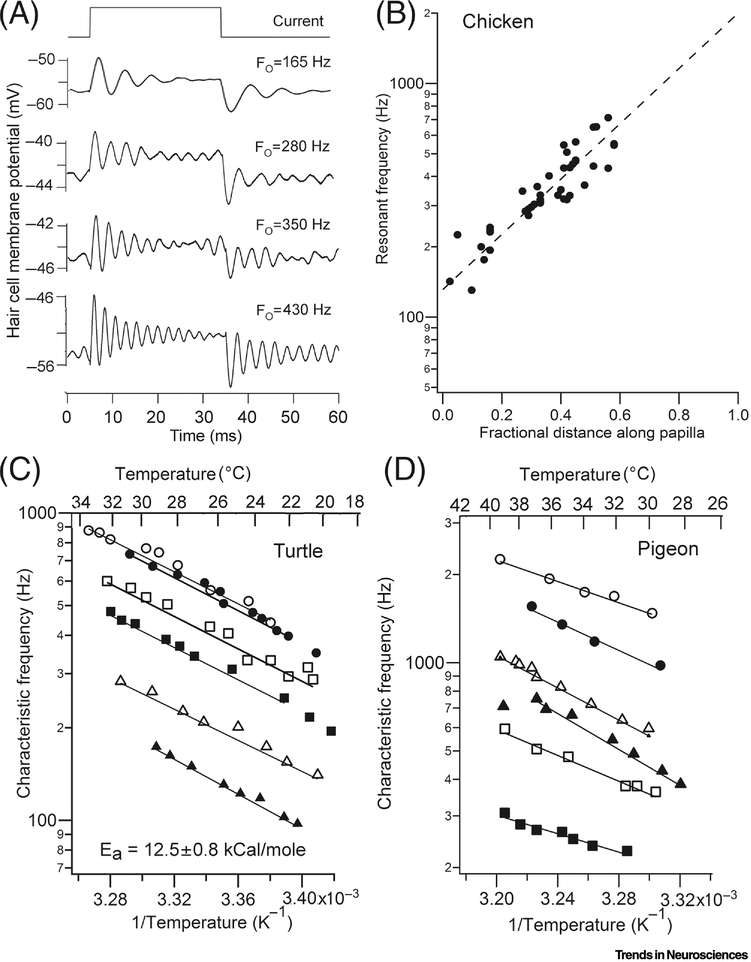
Figure 3.
Electrical tuning in reptile and bird. (A). Example of voltage ringing in four tall hair cells of chicken. (B) Tonotopic map of resonant frequencies in chicken cochlea (T = 33°C); the fit to the resonant frequency measurements is extrapolated to base giving predicted FO of 2 kHz. (C) Arrhenius plots of temperature dependence of characteristic frequencies for sound stimuli in six auditory nerve fibers of turtle. (D) Arrhenius plots of temperature dependence of characteristic frequencies for sound stimuli in six auditory nerve fibers of pigeon; results replotted from reference [40]. Fits giving activation energies Ea have similar slopes in turtle and bird.

