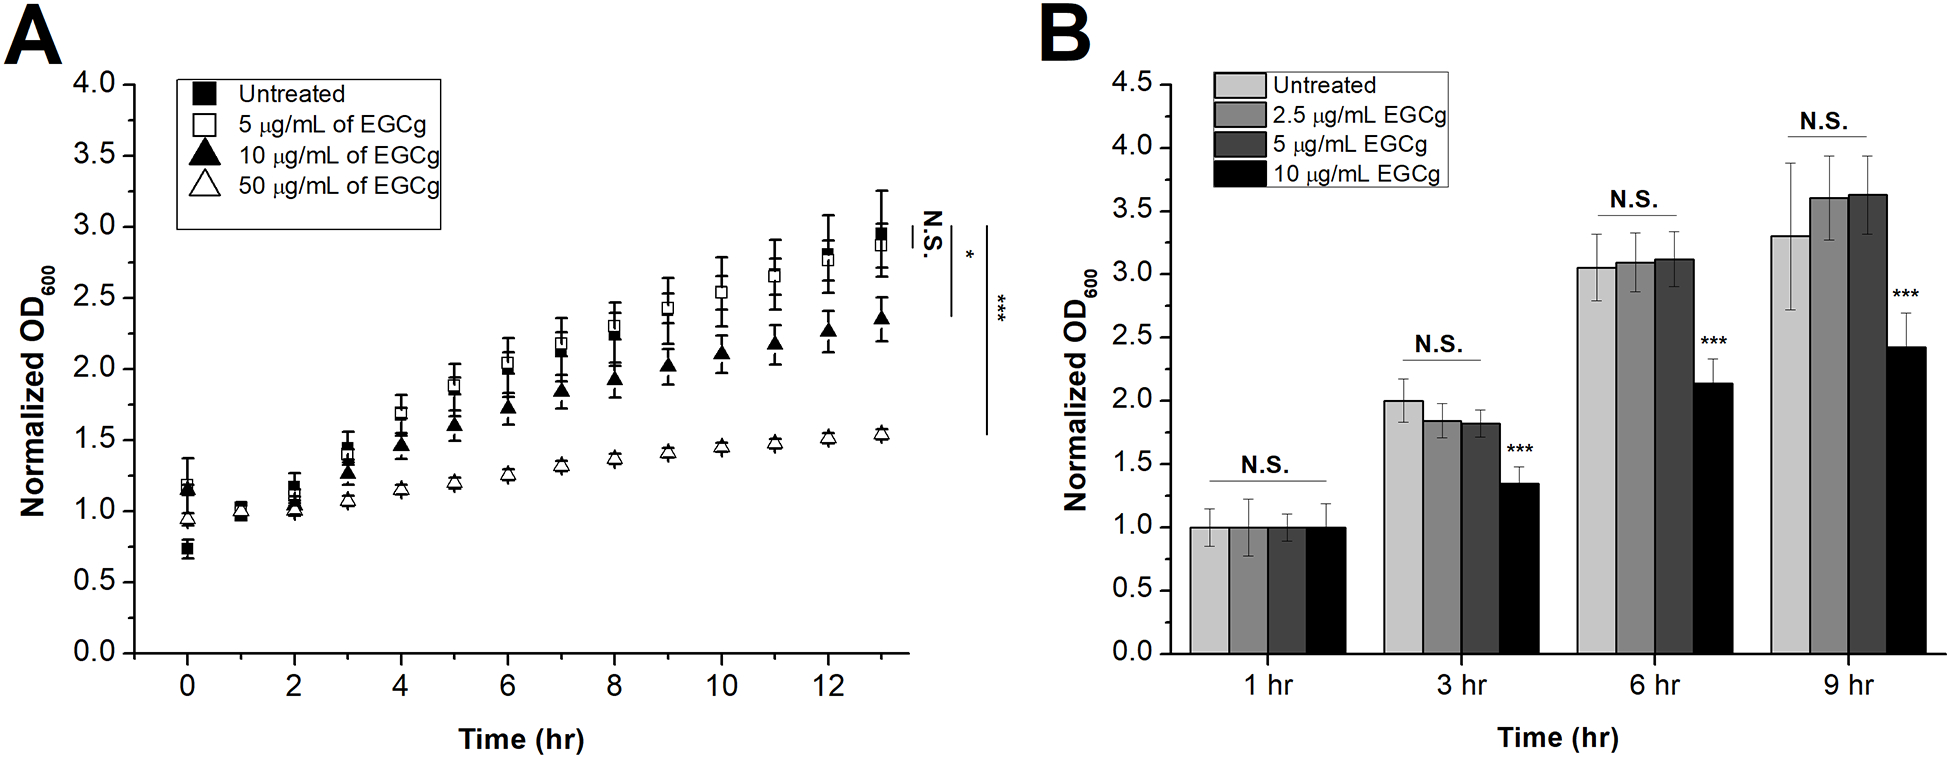
Figure 1. EGCg-Mediated Inhibition of A. actinomycetemcomitans Growth.

An overnight culture of A. actinomycetemcomitans was diluted to OD600 = 0.15 and treated with varying concentrations of EGCg. (A) Growth curve of A. actinomycetemcomitans treated with PBS (black squares) or EGCg at concentrations of 5 μg/mL (white squares), 10 μg/mL (black triangles), or 50 μg/mL (white triangles). The optical densities of five independent samples and five independent baselines for each concentration were observed for a 13-hr period, and the average of each baseline was subtracted from its corresponding samples and averaged. The resultant data points were normalized to the corresponding 1-hr time point. Data are presented as the mean (N=5) ± standard deviation. The level of significance, relative to untreated control was determined using ANOVA. N.S., not significant; *, p < 0.01; ***, p < 0.001. (B) Growth of A. actinomycetemcomitans treated with PBS or EGCg at concentrations of 2.5 μg/mL, 5 μg/mL, and 10 μg/mL of EGCg. The optical densities of five independent samples and five independent baselines for each concentration were observed for 1, 3, 6, 9-hr time points, and the average of each baseline line was subtracted from its corresponding sample and averaged. The resultant data points were normalized to the 1-hr time point of each corresponding curve. Data are presented as the mean (N=5) ± standard deviation. The level of significance, relative to untreated control was determined using a two-tailed student’s t-test. N.S., not significant; ***, p < 0.001.
