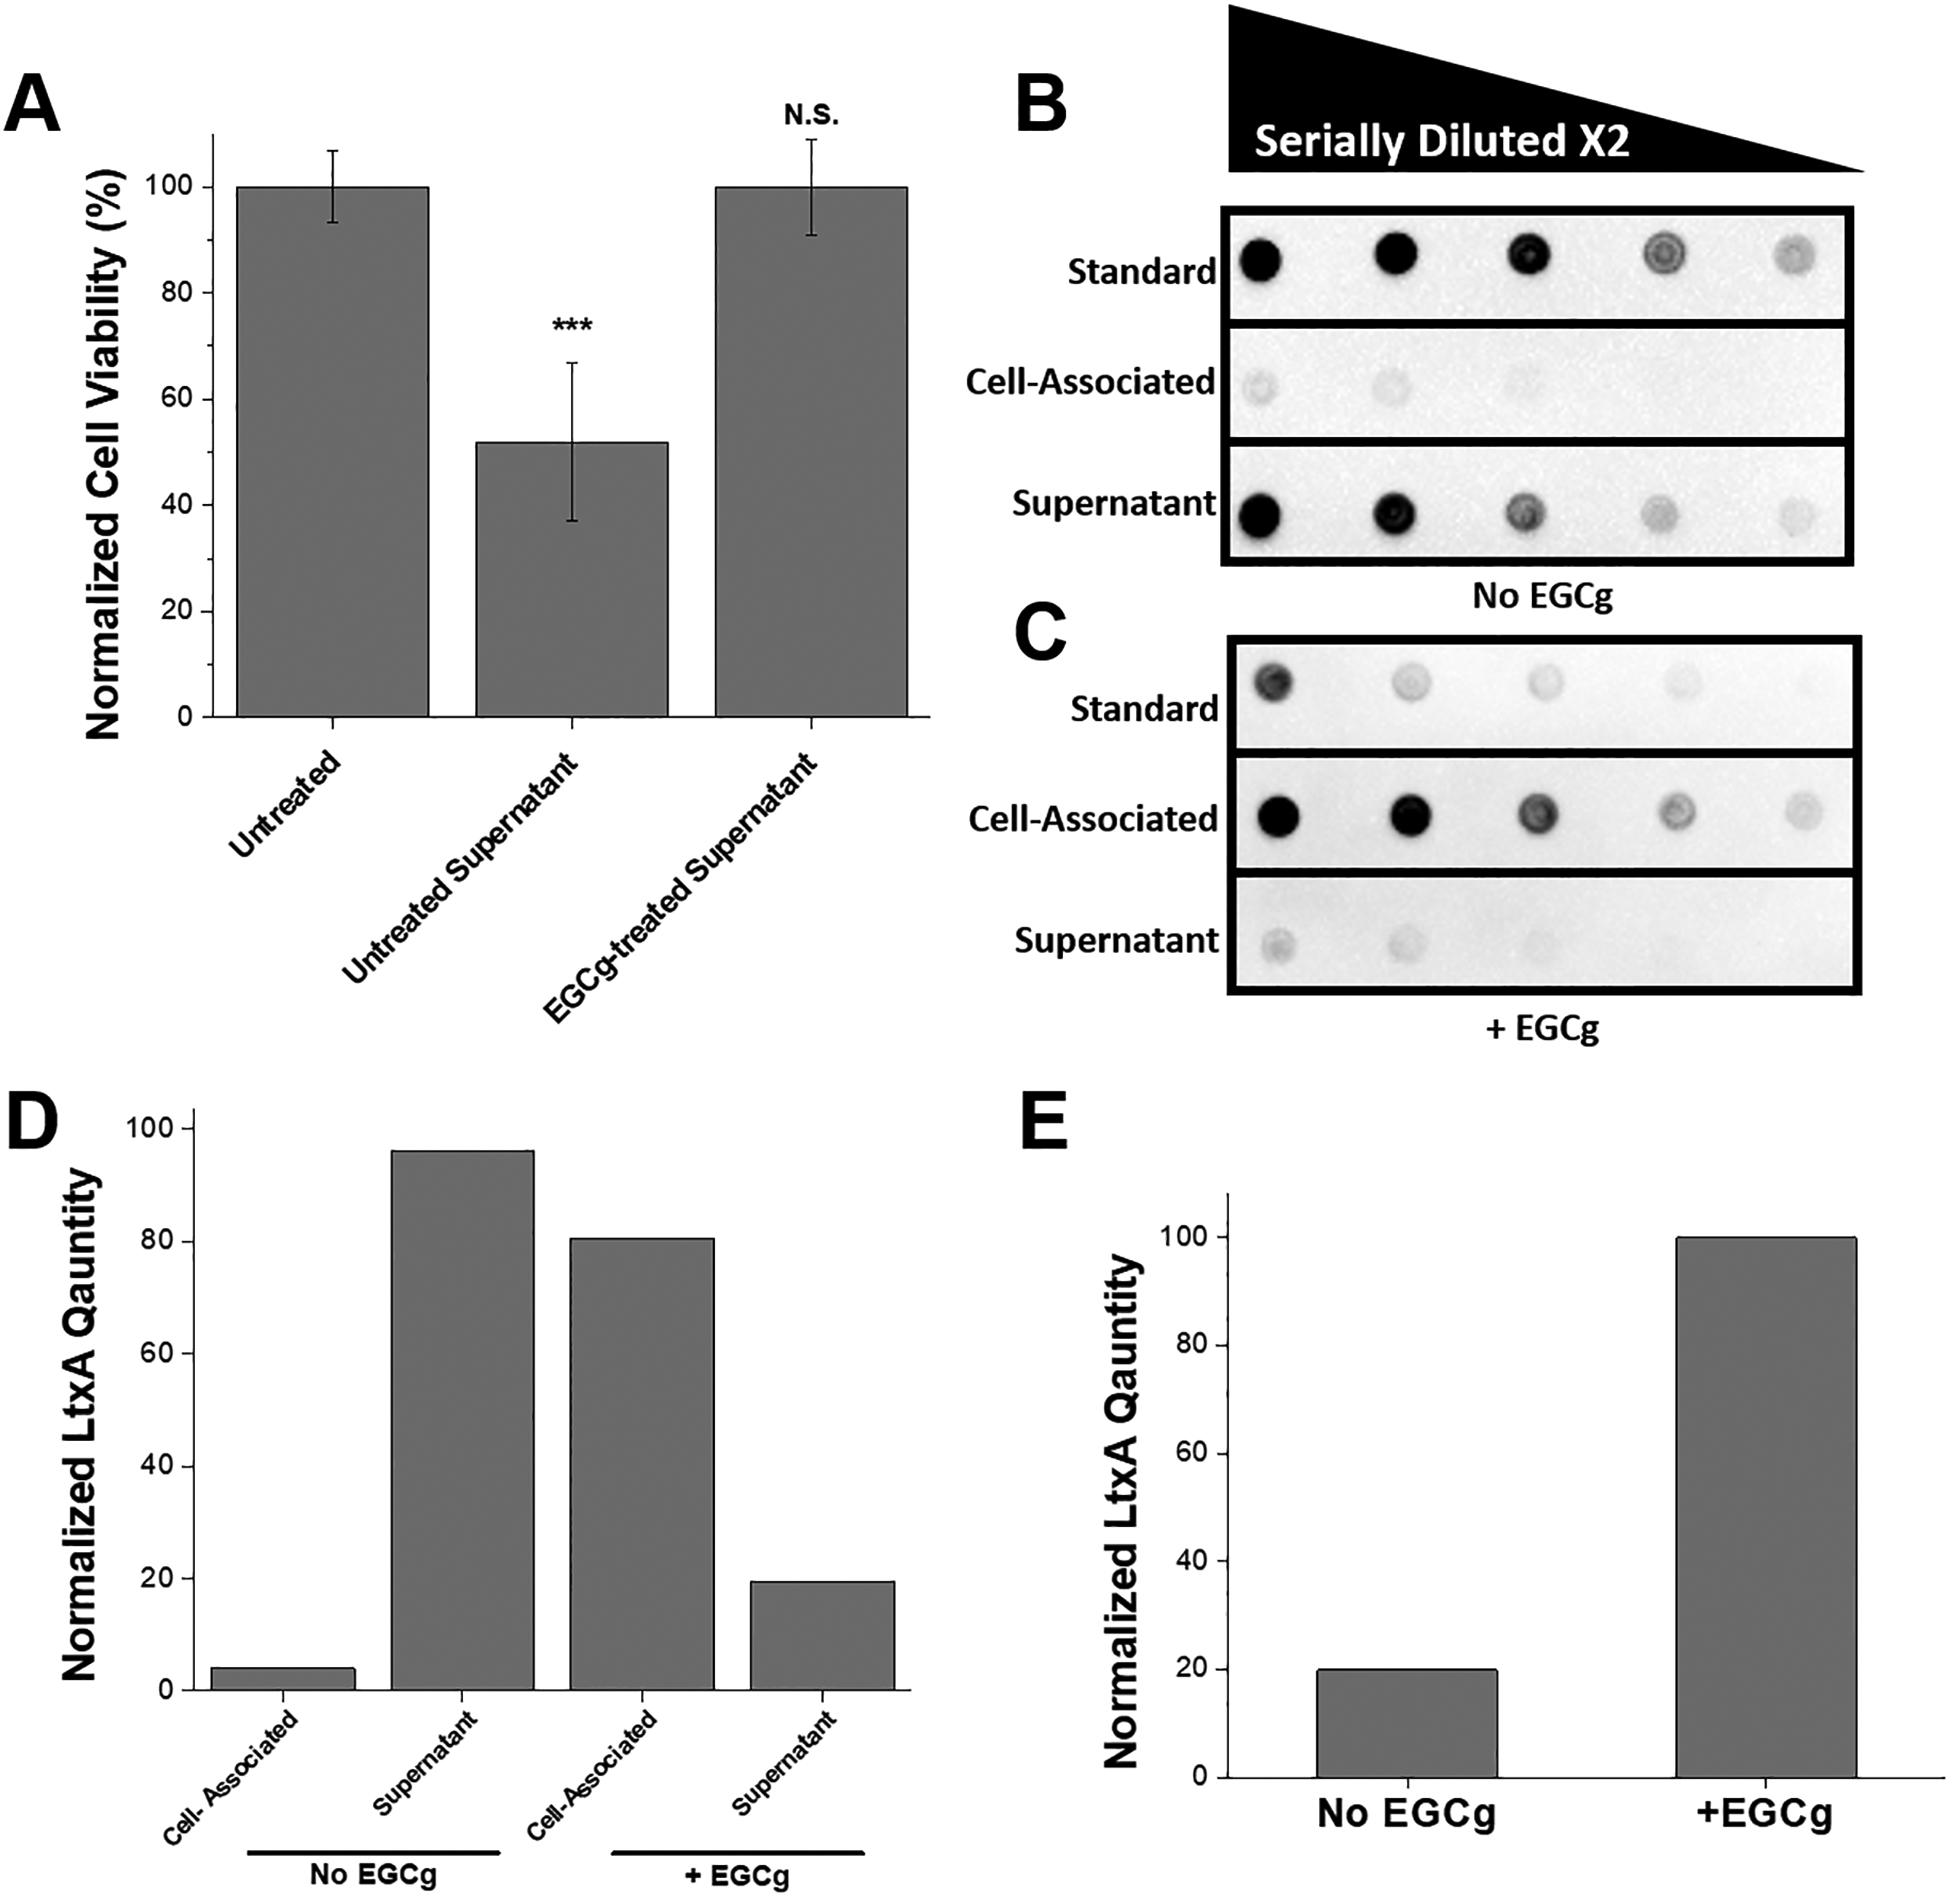
Figure 2. Release of LtxA into A. actinomycetemcomitans Supernatant.

(A) Cytotoxicity of supernatant collected from untreated A. actinomycetemcomitans and EGCg-treated A. actinomycetemcomitans. The bacteria were pelleted from 1 mL culture, and 10 μL from the supernatant was collected and added to 100 μL of THP-1 cells at a concentration of 2 × 10⁶ cells/mL. The cell viability was measured using Trypan blue after 3 hrs of incubation at 37 °C under 5% CO2, and the viability was normalized to that of untreated THP-1 cells. Data are presented as the mean (N=3) ± standard deviation. The level of significance, relative to untreated control was determined using a two-tailed student’s t-test. N.S., not significant; ***, p < 0.001. (B) Immunoblot for LtxA associated with A. actinomycetemcomitans cells or released into the supernatant. The first row represents the LtxA standard, where the first dot consists of 50 μg/mL of free LtxA, then serially diluted by a factor of two. The second row represents the amount of LtxA associated with untreated A. actinomycetemcomitans cells, where the first dot is the bacterial cell pellet resuspended in PBS. The third row represents the LtxA in the untreated A. actinomycetemcomitans supernatant, after cold ethanol precipitation, and resuspended in PBS. Rows two and three are also serially diluted by a factor of two. (C) Immunoblot for LtxA associated with EGCg-treated A. actinomycetemcomitans cells or released into the supernatant. The first row represents the EGCg-treated LtxA standard, where the first dot consists of 50 μg/mL of free LtxA that has been pretreated with 4 μg/mL of EGCg, then serially diluted by a factor of two. The second row represents the amount of LtxA associated with EGCg-treated A. actinomycetemcomitans cells, where the first dot is the bacterial cell pellet resuspended in PBS. The third row represents the LtxA in the EGCg-treated A. actinomycetemcomitans supernatant, after cold ethanol precipitation, and resuspended in PBS. Lanes two and three are also serially diluted by a factor of two. (D) Normalized amounts of LtxA associated with the A. actinomycetemcomitans cells or released into the supernatant in the absence and presence of 5 μg/mL EGCg. The mass of LtxA was calculated from the standard, and the percentage of the total is shown. (E) Quantification of the total amount of LtxA produced by EGCg-treated and untreated A. actinomycetemcomitans.
