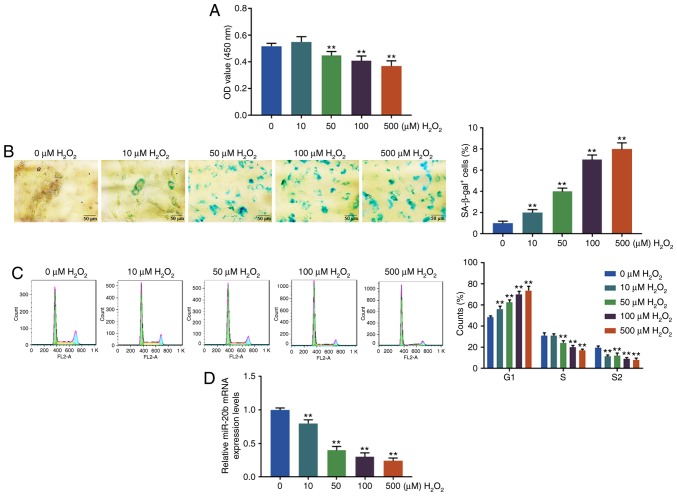
Figure 1.
Cell senescence induced by oxidative stress. (A) Cell viability was determined by Cell Counting Kit-8. (B) Cell senescence was detected by SA-β-gal staining. (C) The cell cycle was determined by flow cytometry. (D) The miR-20b level was detected by reverse transcription quantitative-PCR. The human umbilical vein endothelial cells were randomly divided into 5 groups and treated with different concentrations of H2O2 (0, 10, 50, 100 and 500 µM). The blank group (0 µM H2O2) was cultured in normal medium. The H2O2 group was incubated by normal medium with different concentrations of H2O2. The experiments were repeated in triplicate. **P<0.001 vs. 0 µM H2O2. miR, microRNA; OD, optical density; SA-β-gal, SA-β-galactosidase.

