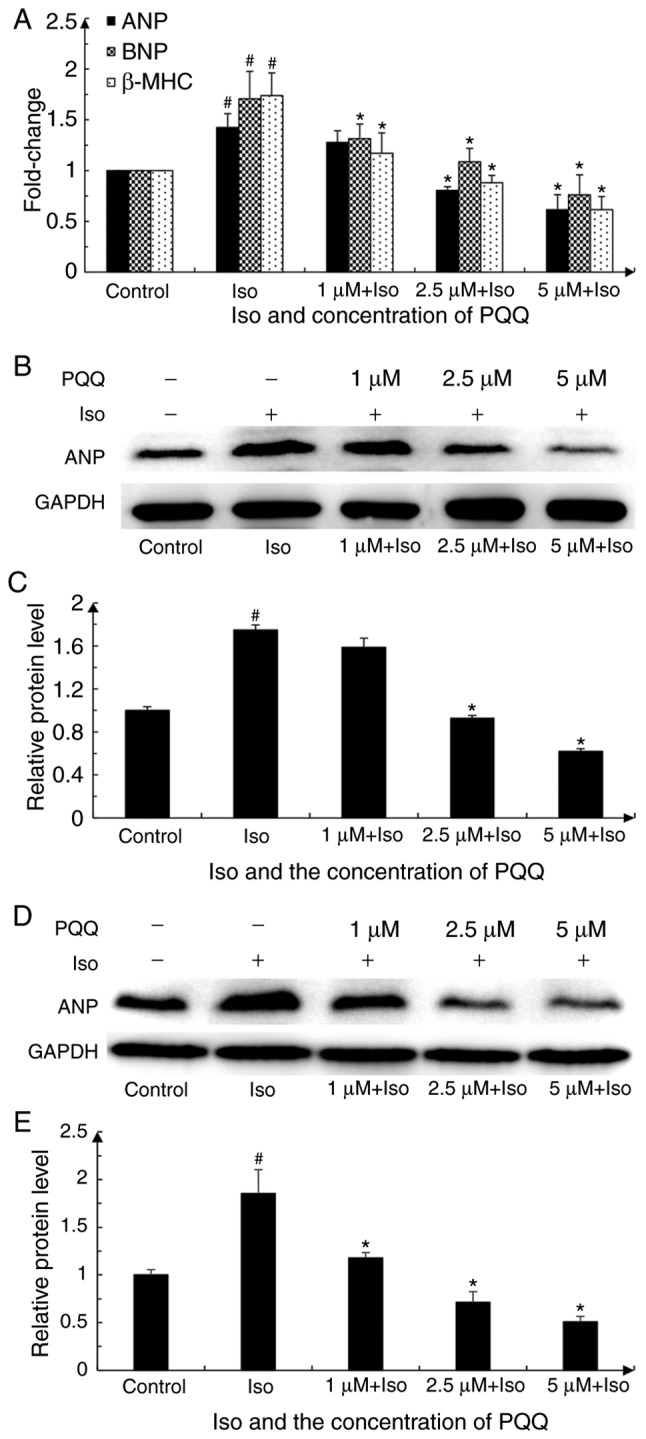
Figure 4.

Effect of PQQ against Iso-induced hypertrophy in AC16 cells is reflected by the changes in cardiac hypertrophic markers. (A) Changes in cardiac hypertrophic markers mRNA levels (groups were set as described in the 'Materials and methods'). The data represent the mean of 3 parallel wells in 3 independent replicate experiments. The control group was set as 1. (B) Changes in protein expression of the cardiac hypertrophy marker, ANP, upon pre-treatment with various concentrations of PQQ or Iso in AC16 cells. GAPDH was used as an internal reference for total protein. The western blot is representative of 3 independent replicate experiments that yielded similar results. (C) Expression of ANP was quantified by ImageJ software. The control group was set as 1. (D) Changes in the protein expression of the cardiac hypertrophy marker, ANP, in H9C2 cells pre-treated with various concentrations of PQQ or treated with Iso. GAPDH was used as an internal reference protein of total protein. The western blot represents 1 of 3 independent replicate experiments that yielded similar results. (E) Expression of ANP was quantified by ImageJ software and we set the control group as 1. #P<0.05 vs. the control group, *P<0.05 vs. the Iso group. PQQ, pyrroloquinoline quinone; Iso, isoproterenol hydrochloride; ANP, atrial natriuretic peptide.
