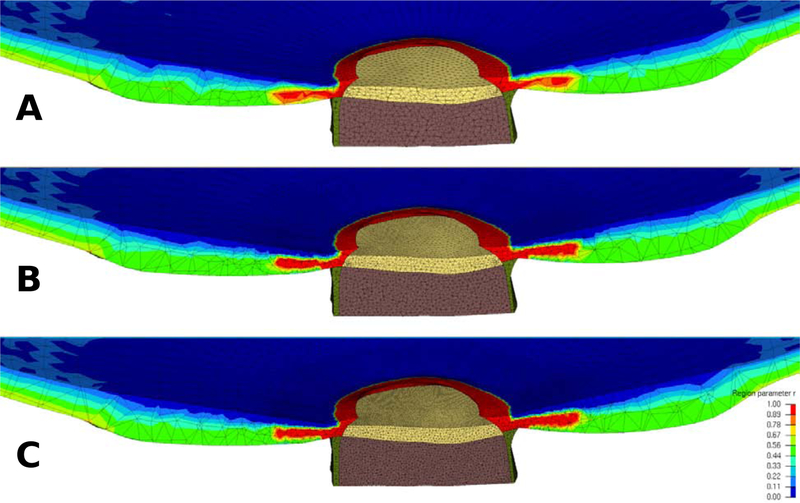
Figure 9:
Contour plot of the region parameter r for models with a coarse (A), medium (B), and fine mesh density (C) in the ONH and peripapillary sclera. The same control points as illustrated in Figure 7 were used for all three models to approximate the region parameter.

