
Figure 1.
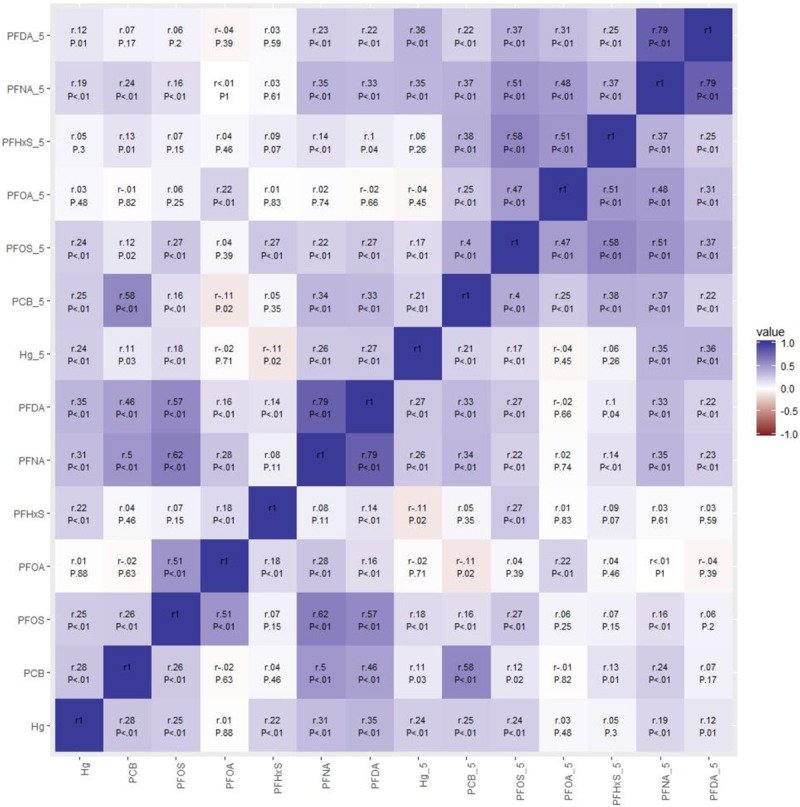
Correlation plot of prenatal and 5-year concentrations. Red indicates negative correlations, whereas blue indicates positive correlations. The intensity of the color indicates the strength of the correlation.
Official websites use .gov
A
.gov website belongs to an official
government organization in the United States.
Secure .gov websites use HTTPS
A lock (
) or https:// means you've safely
connected to the .gov website. Share sensitive
information only on official, secure websites.
Correlation plot of prenatal and 5-year concentrations. Red indicates negative correlations, whereas blue indicates positive correlations. The intensity of the color indicates the strength of the correlation.