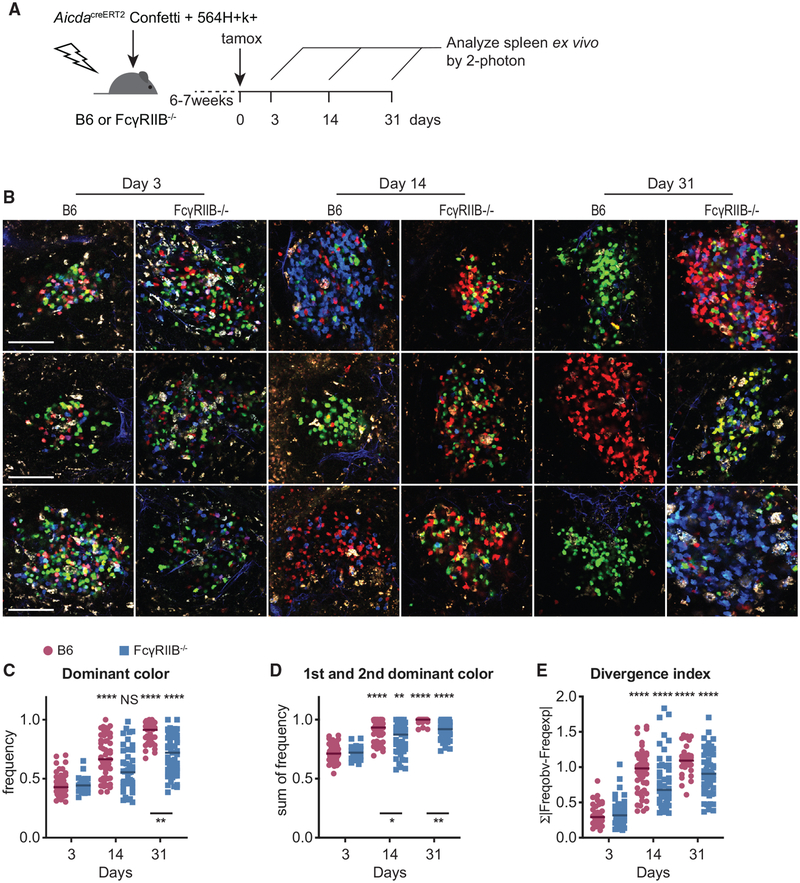
Figure 3. Increased GC B Cell Diversity in the Absence of FcγRIIB on FDCs.
(A) Experimental setup to assess the role of FcγRIIB on FDCs during B cell selection. B6 or FcγRIIB−/− mice received mixed BM cells from 564Igi and AicdaCreERT2Confetti mice (1:2 ratio) after lethal irradiation. Six to seven weeks after BM transfer, mice were treated with a single gavage of tamoxifen to induce the confetti cassettes in GC B cells. Splenic GC in ~2-mm-thick splenic sections were imaged ex vivo at the indicated time points post-tamoxifen treatment.
(B) Representative images cropped from multiphoton optical sectioning of spleens from B6 or FcγRIIB−/− recipients 3, 14, or 31 days post-tamoxifen treatment. Scale bar, 100 μm. All of the images are scaled equally.
(C–E) Quantification of color dominance in splenic GCs from B6 (red circles) or FcγRIIB−/− (blue squares) mixed BM recipients. Images were blinded for recipient genotype before counting. The graphs depict the frequency of the most dominant color (C), the sum of frequencies of 1st and 2nd most dominant clone (D), and the divergence index (E). The color distribution for B6 recipients at day 3 was used to calculate the divergence index for all of the points. Each point represents one GC; the line indicates the median. Pooled data from 4 independent experiments, n = 3–6 mice for each genotype at each time point. Kruskal-Wallis with Dunn’s post hoc testing for statistical analysis. Asterisks above the graphs indicate significance relative to day 3 post-tamoxifen within genotypes; asterisks below the graphs indicate the significance between genotypes within time points. The tests comparing between time points and between genotypes were included in adjusted p value calculations, but they are not indicated.

