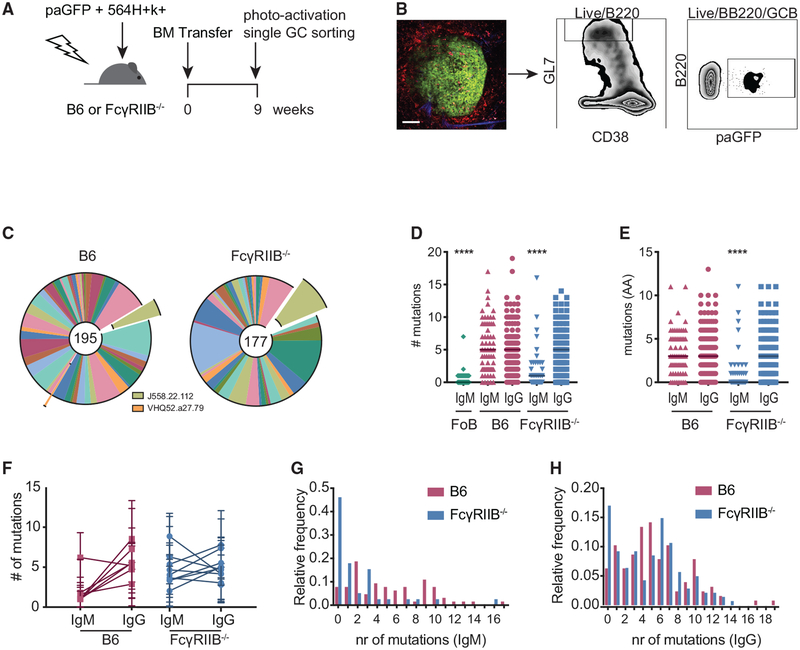
Figure 5. Decreased SHM in IgM+ B Cell Clones in FcγRIIB−/− 564Igi Mixed BM Chimeras.
(A) Experimental setup to analyze B cell clones from individual GCs. B6 or FcγRIIB−/− mice received a mix of 564Igi- and paGFP-derived BM cells (1:2 ratio) after lethal irradiation.
(B) Sorting strategy for sorting photoactivated GC B cells from single GCs in the spleen. Nine weeks post-BM transfer, mice were euthanized and ~2-mm-thick spleen sections were imaged by 2-photon microscopy. Mice had received phycoerythrin immune complexes (PE:IC) 1 day before the endpoint and CD169-PE 30 min before the endpoint to visualize FDC networks and marginal zone macrophages bordering the follicles. GCs were identified by the presence of auto-fluorescent tingible body macrophages. One GC was photoactivated per spleen section. After generating single-cell suspensions and staining for GC markers, photoactivated Gl7hiCD38lo cells were sorted. Scale bar, 100 μm.
(C) Global distribution of VH usage between GC B cells from B6 and FcγRIIB−/− recipients. VH segments found to be involved in 564Igi-induced GCs in previous studies are indicated (Degn et al., 2017). The numbers in the center of the charts reflect the total analyzed sequences (n = 3 mice per group). (D) Somatic hypermutation within Fr1-CDR3 as measured by the number of mismatched nucleotides compared to best matched germline cassettes. Follicular B cells (FoBs) from a naive paGFP mouse were used as a negative control. Each point indicates one IgH sequence; the line indicates the median. ****p < 0.0001, Kruskal-Wallis with Dunn’s post hoc testing, compared to all of the groups within the graph. Not indicated is the statistical significance between the IgM FoB group and the FcγRIIB−/− IgM group; p = 0.03.
(E) Mutation analysis as in (D) at the amino acid level, ****p < 0.0001, Kruskal-Wallis with Dunn’s post hoc testing, compared to all of the groups within the graph.
(F) Number of mutations per GC per isotype. The linked points represent the mutation rates in IgM+ and IgG+ clones in one GC. Error bars represent SDs.
(G and H) Distribution of SHM at the nucleotide level for IgM (G) and IgG (H). Sequences were obtained from 3 mice per group for chimeras and 1 naive paGFP mouse as a WT sequencing control. Number of sequences analyzed per group: n = 86 for IgM FoB sequences, n = 64 for IgM B6 recipient sequences, n = 127 for IgG B6 recipient sequences, n = 39 for IgM FcγRIIB−/− recipient sequences, and n = 141 for IgG FcγRIIB−/− recipient sequences.

